
Building a Vibration Monitoring Program for Rotating Machinery
On this page
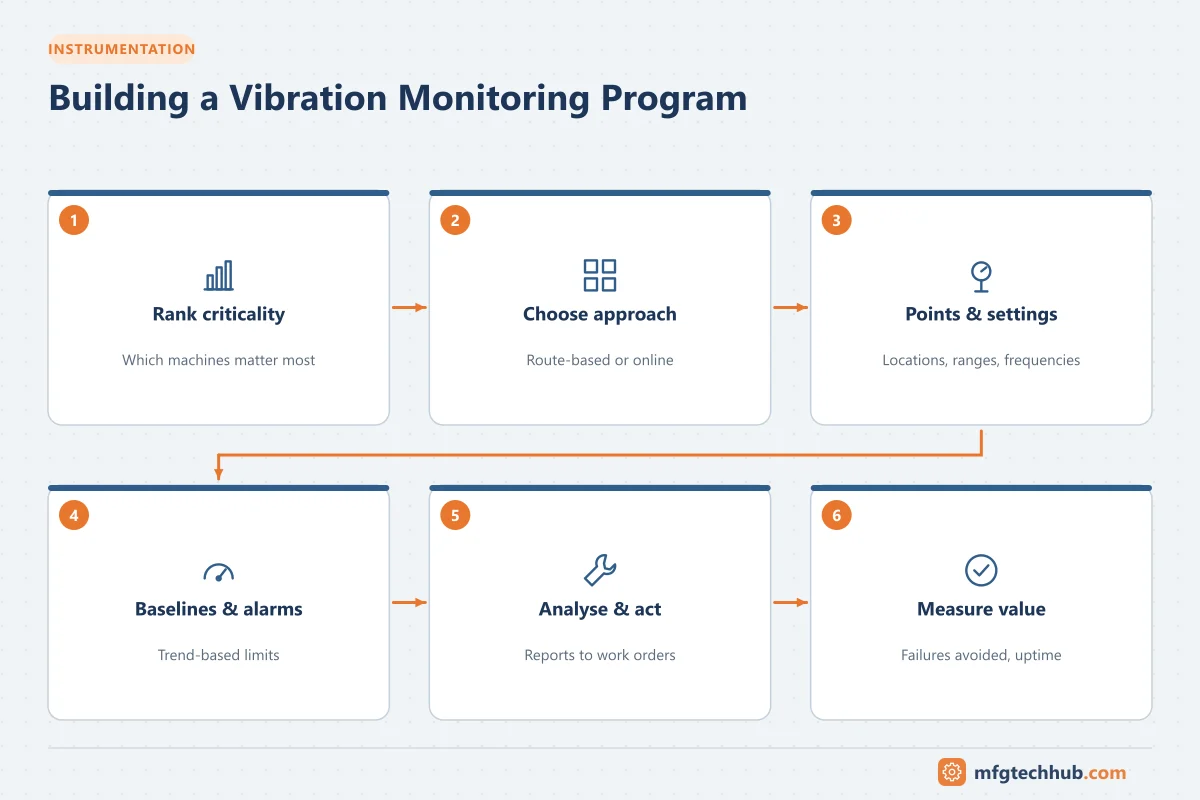
Knowing how to analyze vibration is only half of the job. The other half is building a program that collects the right data from the right machines at the right frequency, turns it into timely maintenance actions, and proves its value. This article explains how to set up and run a vibration monitoring program for pumps, motors, fans, compressors and gearboxes.
For the measurement and analysis basics, read Vibration Analysis for Rotating Equipment.
Why condition monitoring works: the P-F curve
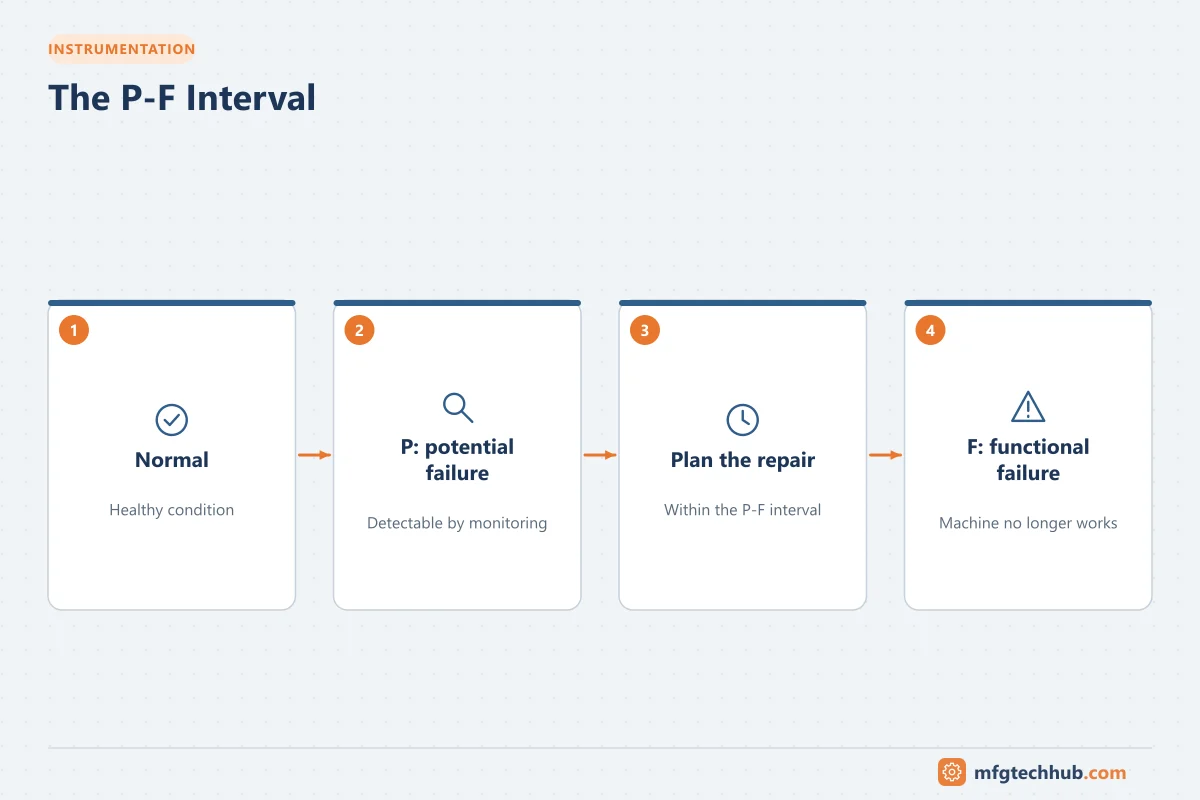
Most machine failures develop over time. The P-F curve describes this:
- P (potential failure): the point where a developing fault can first be detected
- F (functional failure): the point where the machine can no longer do its job
Vibration analysis typically detects bearing and mechanical faults well before other symptoms such as noise and heat. The P-F interval is the warning time available to plan a repair. Monitoring intervals must be shorter than the P-F interval, or faults will be missed.
Step 1: Rank machines by criticality
| Criticality | Characteristics | Typical monitoring |
|---|---|---|
| Critical | No spare; failure stops production or creates safety or environmental risk | Online continuous monitoring, often with protection functions |
| Essential | Important, may have a spare, costly to repair | Route-based or wireless monitoring, monthly or more often |
| General | Spared, low cost, easy to replace | Less frequent routes or basic overall checks |
Consider production impact, safety, repair cost, lead time for spares, and failure history.
Step 2: Choose the monitoring approach
| Approach | Description | Strengths | Limitations |
|---|---|---|---|
| Route-based (portable) | A technician collects data with a portable analyzer on a regular route | Low hardware cost, detailed spectra | Labor-intensive; faults can develop between visits |
| Online (permanent) | Permanently mounted sensors connected to a monitoring system | Continuous data, alarms, protection for critical machines | Higher cost per machine |
| Wireless sensors | Battery-powered sensors send overall values and periodic spectra | Low installation cost, more frequent data than routes | Limited data resolution and battery management |
| Protection systems | Continuous monitoring with automatic trips (for example to API 670 on large turbomachinery) | Protects critical machines from catastrophic failure | Specialized, expensive |
Many programs combine all of these, matched to machine criticality.
Step 3: Define measurement points and settings
- Measure at each bearing, in horizontal, vertical and axial directions where possible.
- Use permanent mounting pads or studs for consistent readings.
- Record machine data: speed, bearing types, number of gear teeth, number of fan or impeller blades, coupling type.
- Configure frequency ranges and resolution to capture expected fault frequencies, plus acceleration or envelope measurements for bearings.
Step 4: Establish baselines and alarms
- Take a baseline when the machine is known to be in good condition, ideally after commissioning or overhaul.
- Set alarm limits using a combination of:
- ISO 20816 severity zones for overall velocity
- Statistical limits from the machine’s own history
- Band alarms on specific frequency ranges (for example bearing frequencies)
- Review and refine alarms to reduce false alarms without missing real problems.
Step 5: Analyze, report and act
- Review alarms and trends on a set schedule.
- Diagnose the likely fault with spectra and other data.
- Report clearly: machine, finding, severity, recommended action and timescale.
- Create a work order in the CMMS.
- Verify after repair with new measurements.
Combine vibration with other techniques for better diagnoses: oil analysis, infrared thermography, ultrasound and motor condition monitoring.
Step 6: People and skills
Vibration analysis requires trained people. ISO 18436-2 defines four categories of certification for vibration analysts, from basic data collection (Category I) to expert analysis (Category IV). Programs work best when:
- Data collectors understand why consistency matters
- Analysts have enough time to review data
- Maintenance planners trust the recommendations
- Feedback from repairs (what was found) is returned to analysts
Step 7: Measure the program’s value
| Metric | What it shows |
|---|---|
| Faults detected before failure | Effectiveness of detection |
| Unplanned downtime of monitored machines | Impact on reliability |
| Maintenance cost avoided | Financial benefit |
| Mean time between failures (MTBF) | Long-term reliability improvement |
| Percentage of recommendations completed | How well findings lead to action |
Document “saves” with photos of damaged parts found during repairs, to build credibility.
Common pitfalls
- Collecting data that no one analyzes
- Inconsistent measurement locations and settings
- Alarms set too high (missed faults) or too low (alarm fatigue)
- Recommendations that are not acted on
- No feedback from maintenance about what was actually found
Key takeaways
- The P-F curve explains why monitoring intervals must match how fast faults develop.
- Match route-based, online and wireless monitoring to machine criticality.
- Baselines, well-set alarms, clear reporting and verified repairs make a program effective.
- Trained people and measured results sustain the program.
Related tutorials
Before you apply this in a plant: this article is for education. Always check the current edition of the relevant standards, the manufacturer's documentation for your exact product and version, and your site's procedures. Safety-related work needs qualified personnel. See our editorial policy.