
Accuracy, Precision, Repeatability and Uncertainty in Industrial Measurement
On this page
“The transmitter is accurate to 0.1 %” sounds precise, but 0.1 % of what, under which conditions, and does it include temperature effects? Understanding the terms used in instrument specifications, and how errors combine, is what separates a measurement that can be trusted from one that only looks good on a data sheet.
The key terms
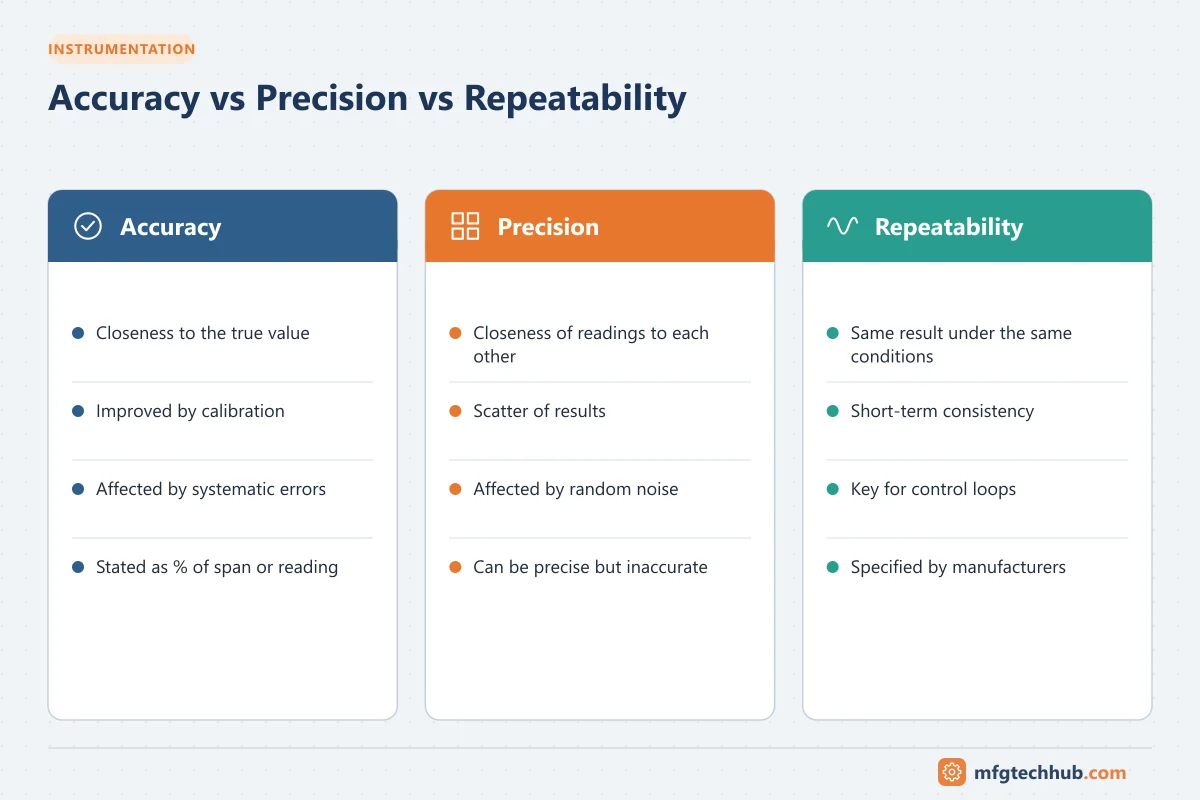
| Term | Meaning | Example |
|---|---|---|
| Accuracy | Closeness of a measurement to the true value | Reads 100.2 °C when the true value is 100.0 °C |
| Precision | Closeness of repeated measurements to each other | Readings 100.2, 100.3, 100.2 are precise even if the true value is 99.0 |
| Repeatability | Precision under the same conditions, same operator, short time | Same transmitter, same pressure, same day |
| Reproducibility | Precision under changed conditions (operator, time, instrument) | Two technicians, two calibrators |
| Resolution | Smallest change that can be displayed or detected | 0.1 °C display step, or ADC bits |
| Hysteresis | Difference between readings approaching a point from above and from below | Gauge reads 50.2 rising, 49.8 falling |
| Linearity | Deviation from a straight-line relationship | Error largest in mid-range |
| Stability (drift) | Change in output over time at constant input | 0.1 % of URL per 5 years |
| Uncertainty | Quantified doubt about a result, with a confidence level | 100.2 °C ± 0.3 °C (k = 2) |
Formal definitions are in the International Vocabulary of Metrology (JCGM 200, VIM).
A measurement can be precise but not accurate (consistent but offset: fix by calibration) or accurate on average but not precise (noisy: fix by installation, filtering or a better sensor).
Reading specifications
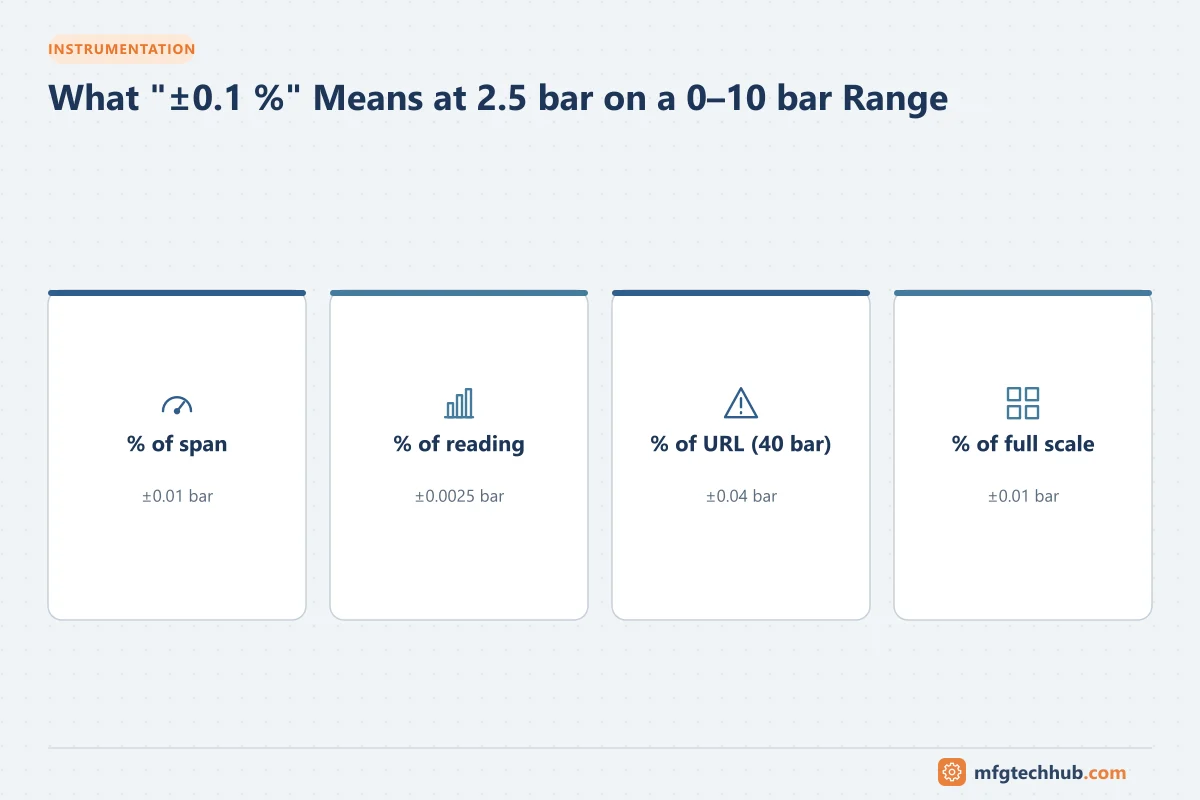
| Expression | Meaning | Error at 25 % of a 0–10 bar range |
|---|---|---|
| ±0.1 % of span | Fixed error based on calibrated span | ±0.01 bar |
| ±0.1 % of reading | Error proportional to the value | ±0.0025 bar |
| ±0.1 % of URL (upper range limit) | Based on the sensor’s maximum range, not your span | If URL is 40 bar: ±0.04 bar |
| ±0.1 % of full scale | Based on the full scale of the instrument | ±0.01 bar if full scale is 10 bar |
Specifications “of URL” penalise heavily turned-down transmitters: a 40 bar sensor ranged 0–10 bar has four times the error in percent of span.
Reference accuracy is measured under reference conditions. Real installations add:
- Ambient temperature effect (often the largest term outdoors)
- Static pressure effect (for differential pressure transmitters)
- Long-term stability
- Installation effects (mounting position, impulse lines, heat from process)
Combining errors: total probable error (illustrative)
Independent random errors are usually combined as the root sum of squares (RSS). Example for a DP transmitter, all values in % of span:
| Error source | Value |
|---|---|
| Reference accuracy | 0.065 % |
| Ambient temperature effect (for a 20 °C change) | 0.15 % |
| Static pressure effect | 0.10 % |
| Total probable error = √(0.065² + 0.15² + 0.10²) | ≈ 0.19 % |
Stability over the calibration interval is then added according to your uncertainty method. The values above are illustrative; use the manufacturer’s specification for your model, range and conditions. Formal uncertainty evaluation follows the GUM (JCGM 100).
Uncertainty and calibration
- Traceability: every calibration compares the instrument with a standard that is itself calibrated, back to national standards. See Calibration and Standardisation.
- Test uncertainty ratio: the calibrator should be several times more accurate than the device under test; 4:1 is a common rule of thumb.
- Tolerance vs uncertainty: a result near the tolerance limit may be neither clearly pass nor clearly fail when uncertainty is considered. Define a decision rule.
How to improve measurement quality
| Problem | Improvement |
|---|---|
| Offset (poor accuracy) | Calibrate; check range configuration; correct installation errors |
| Noise (poor precision) | Improve grounding and shielding, damping, better mounting, averaging |
| Temperature effects | Shield from sun and heat, choose sensors with lower temperature coefficients, compensate |
| Turndown too high | Choose a sensor range closer to the working range |
| Drift | Shorter calibration intervals, better sensor type, diagnostics |
| Poor resolution | Higher-resolution I/O, correct scaling |
See Signal Conditioning and Data Acquisition and Grounding and Earthing.
Frequently asked questions
What is the difference between accuracy and precision?
Accuracy is how close a measurement is to the true value. Precision is how close repeated measurements are to each other. An instrument can be precise but inaccurate if it has a consistent offset.
What does ±0.1 % of span mean?
That the error can be up to 0.1 % of the calibrated span (upper minus lower range value) anywhere in the range. For a 0–10 bar span, that is ±0.01 bar.
How are instrument errors combined?
Independent random errors are usually combined by root sum of squares (RSS) to give a total probable error. Formal uncertainty budgets follow the GUM.
Key takeaways
- Accuracy, precision, repeatability and uncertainty mean different things.
- Check whether specifications refer to span, reading, URL or full scale.
- Real installations add temperature, static pressure, stability and installation errors.
- Combine independent errors by RSS and calibrate with traceable standards.
Related tutorials
Before you apply this in a plant: this article is for education. Always check the current edition of the relevant standards, the manufacturer's documentation for your exact product and version, and your site's procedures. Safety-related work needs qualified personnel. See our editorial policy.