
Real-Time Power Monitoring in Manufacturing: A Practical Example
On this page
Real-time power monitoring turns the monthly electricity bill into live, detailed information: which lines, machines and utilities use energy, when, and how efficiently. This article walks through a typical implementation in a manufacturing plant, from planning to the findings that usually produce savings.
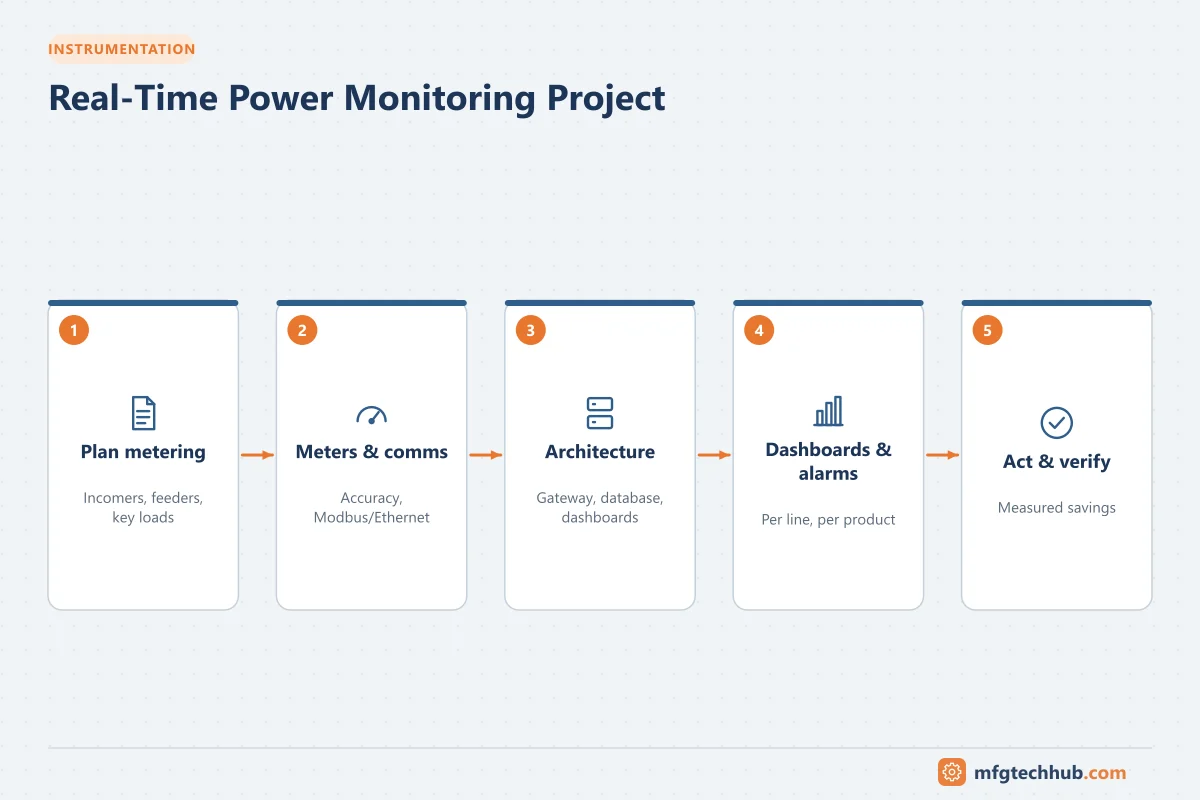
The example below is an illustrative composite based on common practice. Numbers are examples to explain the method, not results from a specific company.
Starting point (illustrative scenario)
A mid-sized plant with several production lines, compressed air, chillers and HVAC has only a utility meter at the incomer. Energy costs are rising, and management wants to reduce consumption and demand charges, and report energy performance.
Step 1: Plan the metering
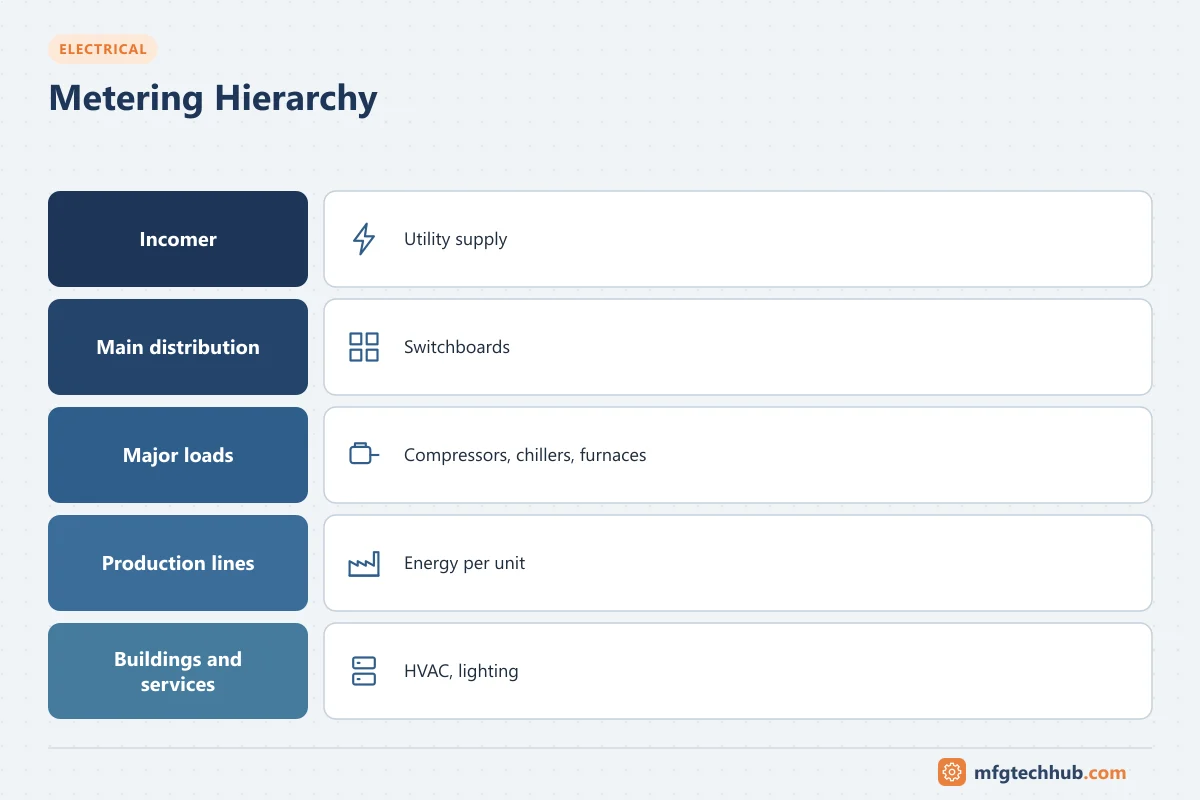
The team builds a metering hierarchy:
| Level | Meters |
|---|---|
| Incomer | Main utility incomer meter with power quality functions |
| Main distribution | Each transformer and main switchboard outgoing feeder |
| Major loads | Compressors, chillers, furnaces, large motors |
| Production lines | Each line’s distribution board |
| Buildings and services | Lighting and HVAC boards |
The goal is to account for most site consumption with a manageable number of meters, rather than metering everything.
Step 2: Choose meters and communication
- Multifunction meters with Modbus TCP or RS-485 communication
- Split-core CTs or Rogowski coils for installation without long shutdowns
- Data collected every few seconds to one minute for real-time dashboards, and stored as 15-minute values for reporting
See Digital Power Meters and Energy Monitoring.
Step 3: Build the system architecture
Meters (Modbus RTU/TCP) → Gateways → Energy monitoring software / SCADA / historian → Dashboards, reports, alarms
                                                   ↑
                                   Production counts from PLCs or MES
Linking energy with production data allows energy per unit and energy per batch to be calculated.
Step 4: Dashboards and alarms
| Audience | Information |
|---|---|
| Operators and supervisors | Live kW by line, energy per unit this shift, idle equipment alerts |
| Maintenance | Abnormal consumption trends, power factor and harmonic alarms |
| Energy manager | Demand profile, baseload, savings verification |
| Management | Monthly energy cost, energy intensity and emissions |
Step 5: Typical findings
These are the kinds of findings power monitoring commonly reveals:
High baseload
Consumption on nights and weekends is a large fraction of weekday consumption, because compressors, HVAC, conveyors, lighting and idle machines keep running. Shutdown checklists and automated controls reduce this.
Demand peaks
The monthly maximum demand is set by a short period when several large loads start together after a break. Staggering startups and adding demand alarms reduce the demand charge. See Smart Grid and Load Management.
Compressed air waste
The compressor’s energy use stays high even when production is low, indicating leaks and poor pressure control. Leak detection and repair and better compressor sequencing reduce consumption.
Differences between similar lines
Two similar lines show different energy per unit, revealing equipment or operating differences worth investigating.
Poor power factor
Measured power factor is below the tariff threshold, causing penalties. A capacitor bank or its failed steps are corrected. See Power Factor Correction.
Early equipment problems
A motor or furnace gradually draws more power for the same output, indicating mechanical wear, fouling or failing insulation, and triggering maintenance.
Step 6: Act and verify
Findings are turned into an action list with owners, estimated savings and priorities. After each action, the monitoring system verifies the actual savings against a baseline adjusted for production volume.
Keys to success
- Start with a clear objective (cost, demand, reporting, maintenance).
- Include production context; raw kWh alone can mislead when volumes change.
- Make data visible to the people who can act on it, such as shift supervisors.
- Assign ownership for energy performance and follow-up actions.
- Maintain the system: check CT ratios, communication and meter health.
Frequently asked questions
How many power meters does a factory need?
Enough to explain most of the site consumption and to see the loads you can influence. Many plants start with the incomer, main feeders and the largest loads such as compressors, chillers and furnaces, and add meters where analysis shows the need.
What data interval should be used?
Real-time dashboards typically use data every few seconds to one minute. For reporting and billing comparisons, 15-minute or 30-minute intervals matching the utility demand interval are standard.
Can existing equipment provide power data?
Often yes. Many VFDs, motor protection relays, intelligent MCCs and air circuit breakers already measure current and power and can share data over industrial networks, reducing the number of new meters required.
Key takeaways
- Real-time power monitoring needs a metering plan, reliable communication and production context.
- Common findings include high baseload, demand peaks, compressed air waste and poor power factor.
- Savings come from acting on findings and verifying results, not from meters alone.
Related tutorials
Before you apply this in a plant: this article is for education. Always check the current edition of the relevant standards, the manufacturer's documentation for your exact product and version, and your site's procedures. Safety-related work needs qualified personnel. See our editorial policy.