
Predictive Maintenance Implementation: A Step-by-Step Example
On this page
Predictive maintenance (PdM) promises fewer breakdowns and lower maintenance costs by fixing equipment just before it fails. Many plants start PdM projects, but not all see results, often because they focus on technology instead of the full workflow from sensor to repair. This article walks through a step-by-step implementation for a group of critical pumps.
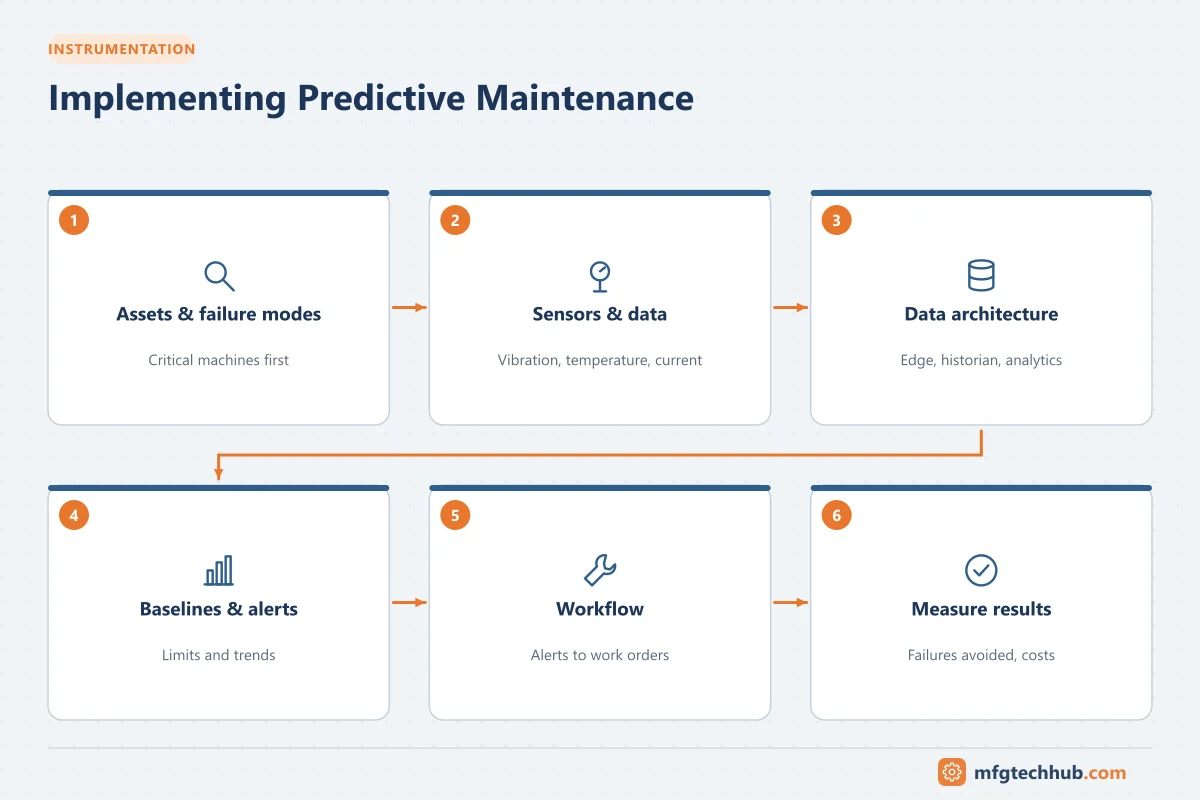
The scenario is an illustrative composite based on common industry practice, not a description of a specific company’s project.
The starting point (illustrative scenario)
A process plant has 20 critical centrifugal pumps. Several unexpected failures each year cause production losses and emergency repairs. Maintenance is time-based: bearings are replaced on a fixed schedule, and monthly walk-around checks look for noise and leaks.
Goal: reduce unplanned pump failures and avoid unnecessary preventive work.
Step 1: Select assets and failure modes
The team reviews failure history and identifies the most common failure modes:
| Failure mode | Detectable by |
|---|---|
| Bearing wear and lubrication problems | Vibration (especially high-frequency/envelope), temperature, ultrasound |
| Misalignment and unbalance | Vibration spectra and phase |
| Mechanical seal failure | Seal chamber temperature, leakage sensors, process conditions |
| Cavitation and operation far from best efficiency point | Vibration, suction pressure, flow, motor power |
| Motor electrical problems | Current, insulation tests, motor protection data |
Choosing techniques based on failure modes, rather than installing sensors everywhere, keeps the project focused. See Vibration Analysis for Rotating Equipment.
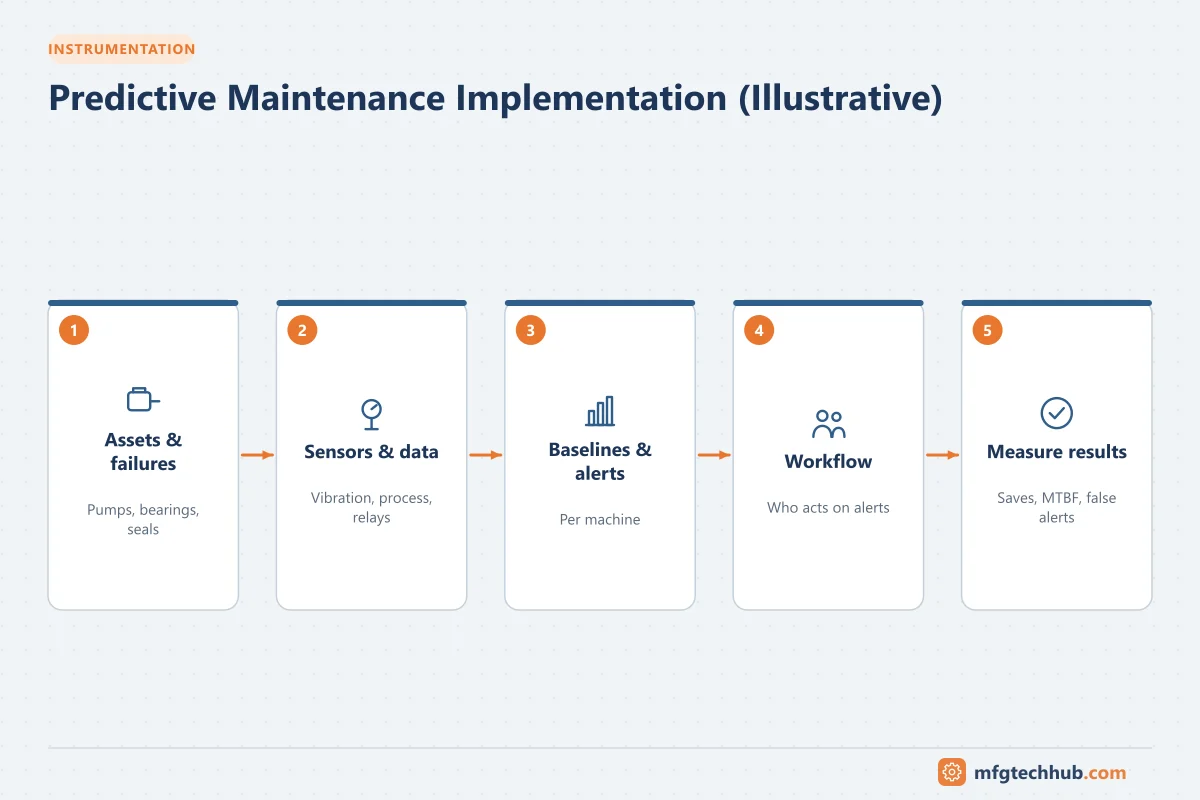
Step 2: Choose sensors and data sources
- Wireless vibration and temperature sensors on pump and motor bearings (low installation cost)
- Existing process data from the DCS: suction and discharge pressure, flow, motor current
- Motor protection relay data: current, thermal capacity and starts
- Maintenance history from the CMMS
Step 3: Build the data architecture
Wireless sensors → Gateway ─┐
DCS / historian (process) ───┼─→ Condition monitoring / analytics platform → Alerts → CMMS work orders
Motor relays (MCC) ──────────┘
Secure connectivity follows the plant’s OT security architecture. See Industrial IoT.
Step 4: Define baselines and alerts
- Collect several weeks of data during normal operation as a baseline.
- Set alert levels using ISO 20816 zones for overall vibration, plus statistical limits for each pump.
- Add condition rules that combine signals, for example: high bearing temperature and rising high-frequency vibration indicates a probable bearing problem.
- Use operating context: ignore alerts when a pump is stopped or on minimum flow.
Machine learning anomaly detection can supplement rules once enough data is available. See AI and Machine Learning in Process Control.
Step 5: Design the workflow
Technology alone does not prevent failures; people must act on alerts:
- An alert is reviewed by a trained analyst within a defined time.
- The analyst confirms the problem (for example with a detailed spectrum or a field check) and estimates urgency.
- A work order with clear recommendations is created in the CMMS.
- Planners schedule the work at the best opportunity, such as switching to the standby pump.
- Technicians record what they found (as-found condition, photos).
- The analyst reviews post-repair data and closes the loop.
Step 6: Adjust preventive maintenance
As confidence grows, fixed-interval tasks such as routine bearing replacement are replaced or extended based on condition, freeing maintenance time for more valuable work.
Step 7: Measure results
| KPI | Purpose |
|---|---|
| Number of unplanned pump failures | Main objective |
| Faults detected early (“saves”) | Evidence of detection capability |
| Mean time between failures (MTBF) | Reliability trend |
| Maintenance cost per pump | Financial impact |
| Alert response time | Workflow health |
| False alert rate | Trust in the system |
Typical outcomes reported for well-run programs of this kind include fewer unplanned failures, planned instead of emergency repairs, and less unnecessary preventive work. Actual results depend on the starting condition, workflow discipline and asset types.
Lessons commonly learned
- Start small with assets that matter and have known failure modes.
- Workflow and ownership matter more than the analytics platform.
- Process context (flow, pressure, running status) reduces false alarms.
- Feedback from repairs is essential to improve alert rules.
- Communicate successes with evidence to maintain support and funding.
Key takeaways
- Choose monitoring techniques based on the dominant failure modes.
- Combine new condition sensors with existing process and electrical data.
- Define a clear workflow from alert to repair to feedback.
- Measure results and adjust preventive maintenance based on condition.
Related tutorials
Before you apply this in a plant: this article is for education. Always check the current edition of the relevant standards, the manufacturer's documentation for your exact product and version, and your site's procedures. Safety-related work needs qualified personnel. See our editorial policy.