
Manufacturing Data and Analytics: KPIs, OEE, Historians and Dashboards Explained
On this page
Every modern plant generates a large amount of data: process values from PLCs and DCS, alarms and events from SCADA, production counts, quality results, maintenance records, energy readings and material movements. Manufacturing analytics is the discipline of turning that data into reliable information that helps people run operations better.
This guide explains where manufacturing data comes from, how it should be structured, which metrics matter most, and how to build analytics that operators, engineers and managers actually use.
Why Manufacturing Analytics Matters
Without good data, improvement efforts depend on opinion and memory. With good data, teams can answer questions such as:
- Why did line 2 produce 12 percent less than planned last week?
- Which product changeovers take the longest, and why?
- Which process conditions are associated with scrap or rework?
- How much energy does each unit of product consume?
- Which assets are most likely to fail in the next month?
The goal is not more dashboards. The goal is faster, better decisions, based on data that people trust.
Types of Manufacturing Data
Time-Series Process Data
Continuous values such as temperature, pressure, flow, speed and current, sampled from sensors, PLCs and DCS controllers. These are usually stored in a process historian or time-series database.
Events and States
Discrete events such as machine start and stop, alarms, faults, changeovers, batch phases and operator actions. Events are essential for understanding why process values changed.
Production and Transactional Data
Work orders, quantities produced, scrap, material consumption, genealogy and labor, typically managed by an MES or ERP system.
Quality Data
Laboratory results, in-line inspection results, statistical process control samples, non-conformances and customer complaints.
Maintenance and Asset Data
Work orders, failure codes, spare parts usage, runtime hours and condition monitoring measurements.
Context Data
The information that ties everything together: equipment hierarchy, product and recipe definitions, shifts, crews, units of measure and specifications. Context is often the most neglected type of data and the most important for useful analytics.
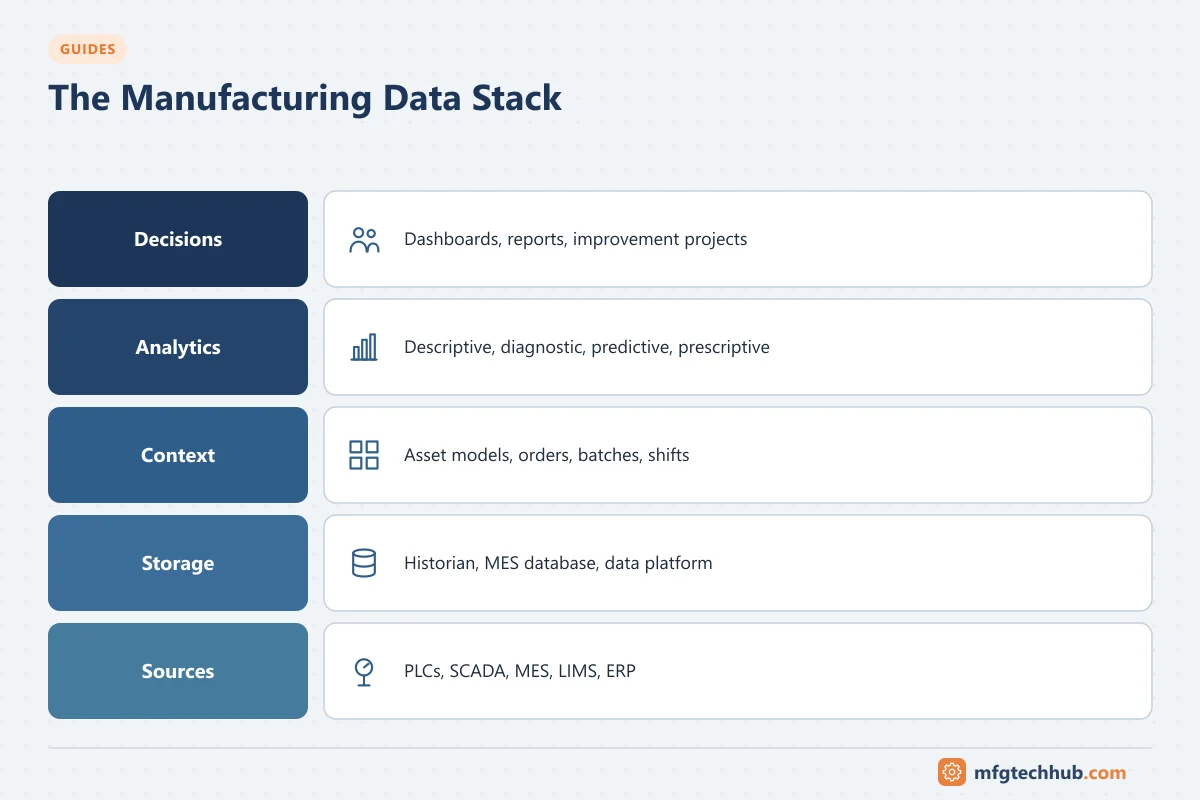
The Manufacturing Data Stack
A typical analytics architecture has several layers.
1. Data Sources
PLCs, DCS, SCADA, instruments, MES, LIMS (laboratory information management systems), CMMS (computerized maintenance management systems) and ERP. Learn more about data collection in MES Data Collection and Integration and SCADA Data Acquisition.
2. Collection and Integration
Connectors, OPC UA servers, MQTT brokers, edge gateways and integration middleware move data out of source systems. The Industrial IoT guide covers these technologies in more detail.
3. Storage
- Process historians are optimized for high-speed time-series data with compression and fast retrieval. See Industrial Historians Explained.
- Relational databases store transactional records such as orders, batches and quality results.
- Data lakes and warehouses combine large volumes of data from many sources for enterprise reporting and advanced analytics.
4. Contextualization and Modeling
This layer maps raw tags to assets, products, batches and time periods. A well-designed equipment model, often based on the hierarchy in ISA-95 (enterprise, site, area, line, work cell), allows the same analysis to be reused across lines and sites.
5. Analysis and Visualization
Dashboards, reports, trend tools, statistical analysis, notebooks and machine learning models. This is the layer users see, but its quality depends entirely on the layers underneath.
Key Manufacturing KPIs
Overall Equipment Effectiveness (OEE)
OEE is the most widely used measure of manufacturing productivity. It combines three factors:
OEE = Availability × Performance × Quality- Availability = Run Time ÷ Planned Production Time
- Performance = (Ideal Cycle Time × Total Count) ÷ Run Time
- Quality = Good Count ÷ Total Count
Worked example: A line is planned to run for 480 minutes and actually runs for 420 minutes. Its ideal cycle time is 1 minute per unit. It produces 380 units, of which 361 are good.
Availability = 420 ÷ 480 = 87.5%
Performance  = (1 × 380) ÷ 420 = 90.5%
Quality      = 361 ÷ 380 = 95.0%
OEE          = 0.875 × 0.905 × 0.950 ≈ 75.2%
The breakdown is more useful than the single number: in this example, the biggest loss is availability, so downtime analysis is the best place to start.
Other Common KPIs
| KPI | What It Measures |
|---|---|
| Throughput | Units produced per hour or shift |
| First Pass Yield (FPY) | Percentage of units that are right first time, without rework |
| Scrap Rate | Percentage of material or units discarded |
| Mean Time Between Failures (MTBF) | Average operating time between breakdowns |
| Mean Time To Repair (MTTR) | Average time to restore equipment after a failure |
| Changeover Time | Time from the last good unit of one product to the first good unit of the next |
| Schedule Adherence | Actual production compared with the plan |
| Energy per Unit | Energy consumed for each unit of output |
Choose a small set of KPIs that link directly to business goals. Too many metrics make it hard to focus.
Types of Analytics
Manufacturing analytics is often described in four levels of increasing maturity.
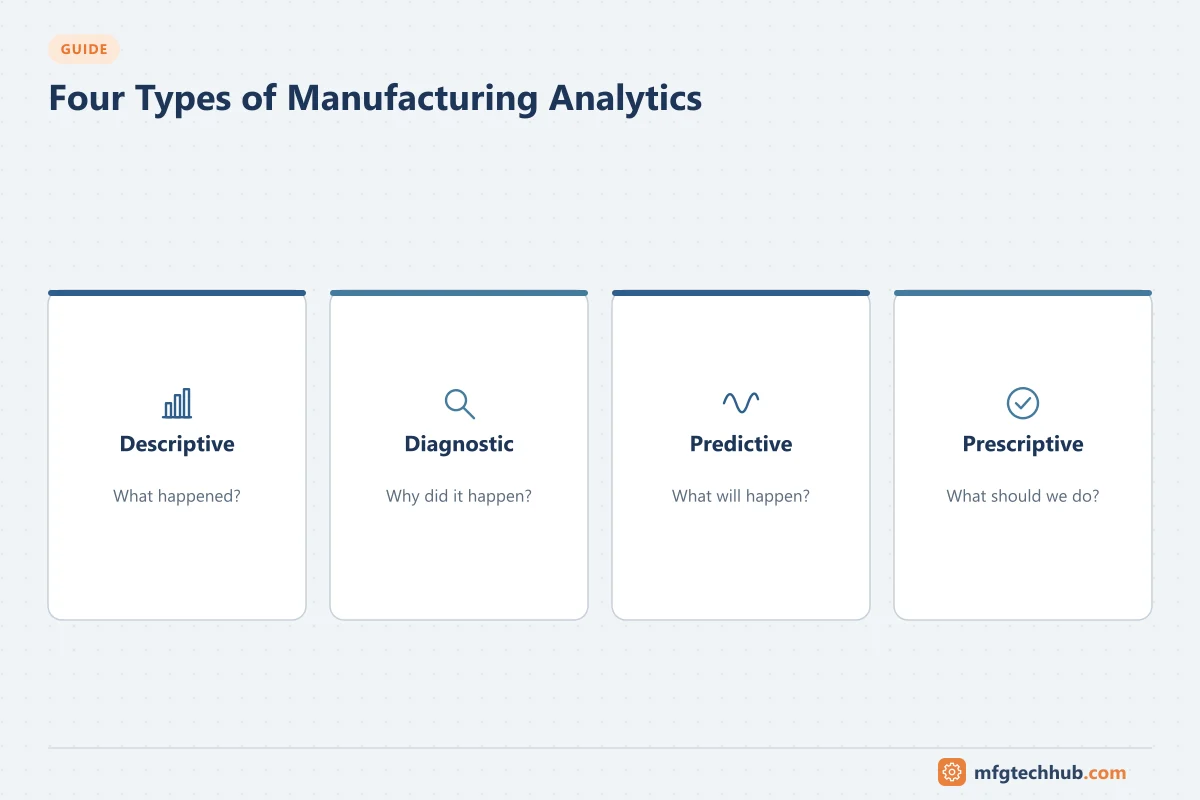
Descriptive Analytics: What Happened?
Shift reports, OEE dashboards, downtime Pareto charts and production summaries. This is the foundation, and most plants gain significant value here before moving further.
Diagnostic Analytics: Why Did It Happen?
Root cause analysis using trends, event correlation, batch comparisons and statistical tools. Comparing a “golden batch” with a poor batch is a classic example.
Predictive Analytics: What Will Happen?
Models that forecast equipment failures, quality outcomes or demand based on historical patterns. See AI in Manufacturing for common approaches.
Prescriptive Analytics: What Should We Do?
Recommendations or optimization, such as suggesting setpoints that reduce energy while keeping quality within limits. Prescriptive analytics requires trustworthy data and careful validation, and a person usually remains responsible for the final decision.
Statistical Process Control (SPC)
Statistical Process Control uses control charts to distinguish normal process variation (common cause) from unusual variation (special cause). Key concepts include:
- Control limits, calculated from process data, typically at ±3 standard deviations from the mean
- Specification limits, defined by customer or product requirements
- Process capability indices such as Cp and Cpk, which compare process spread with specification width
SPC helps teams react to genuine process changes and avoid over-adjusting a stable process.
Designing Dashboards People Use
A dashboard is only useful if it changes what people do. Good practice includes:
- Design for a specific audience. Operators need real-time status and clear targets; managers need trends and comparisons.
- Show targets and context, not only values. “Line speed 118” means little without “target 125”.
- Keep it simple. Use a few clear charts rather than many gauges.
- Make exceptions obvious. Highlight what needs attention now.
- Link to detail. Allow users to drill down from a KPI to the events and data behind it.
- Review regularly. Retire dashboards no one opens.
For examples of reporting in manufacturing systems, see MES Reporting and Analytics.
Data Quality: The Foundation of Analytics
Poor data quality is the most common reason analytics projects fail. Watch out for:
- Missing or frozen values caused by communication failures or bad sensors
- Incorrect timestamps and unsynchronized clocks between systems
- Inconsistent tag names across lines or sites
- Manual entries without validation, such as free-text downtime reasons
- Unit of measure mismatches between systems
- Compression settings that remove important detail from historian data
Practical steps include time synchronization (for example, NTP across OT systems), standard naming conventions, validated reason-code lists, and simple automated checks for stale or out-of-range data.
Getting Started with Manufacturing Analytics
- Pick one important problem, such as downtime on a bottleneck line.
- Automate data capture for machine states, counts and rejects where possible.
- Define clear rules, including what counts as planned downtime and what the ideal cycle time is.
- Build a simple view that the team reviews daily.
- Act on the findings, and track whether the KPI improves.
- Standardize and scale the data model and dashboards to other lines.
Starting small and proving value builds the trust needed for larger analytics initiatives.
Continue Learning
- MES: Better Decision-Making with Data-Driven Insights
- MES Data Analytics and AI
- MES Real-Time Visibility and Traceability
- SCADA Data Processing
- Industrial Measurement: Accuracy, Precision and Repeatability
- Industrial IoT (IIoT)
Frequently Asked Questions
What is the difference between a historian and a data lake?
A process historian is optimized for storing and retrieving high-frequency time-series data from industrial systems, often with built-in compression and trending tools. A data lake stores many types of data, structured and unstructured, from many sources, and is typically used for enterprise reporting and data science. Many organizations use both.
What is a good OEE score?
It depends heavily on the industry, product mix and how OEE is calculated. Instead of comparing with a generic benchmark, it is more useful to calculate OEE consistently and track improvement over time on the same equipment.
Do we need data scientists to start?
No. Most early value comes from reliable data capture, clear KPIs and simple descriptive analytics that engineers and supervisors can build and use. Data science skills become important for predictive and prescriptive use cases.