
MES Reporting, KPIs and Analytics: OEE, ISO 22400, Dashboards, Root Cause and AI Use Cases
On this page
Reporting is where MES data turns into decisions: what to fix on the line this hour, which losses to attack this month, and which batch can be released. Good MES reporting depends on three things: consistent KPI definitions, reliable data with context, and reports designed for a specific audience and decision.
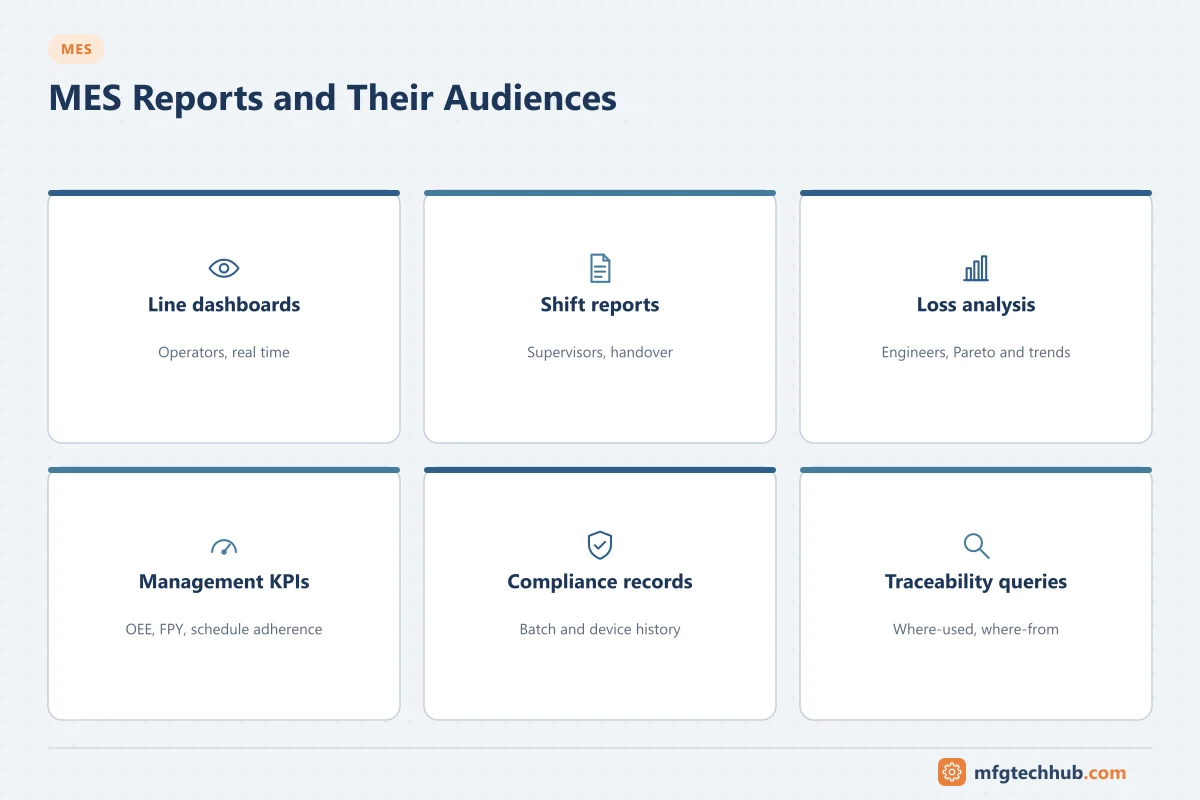
This guide covers report types, KPI definitions, loss analysis, and where advanced analytics and AI genuinely help.
Report types and their audiences
| Report | Audience | Timeframe | Purpose |
|---|---|---|---|
| Line dashboards / andon | Operators, team leaders | Real time | Is the line on target now? What is stopping it? |
| Shift and handover reports | Shift supervisors | Per shift | Output, losses, open issues, quality holds |
| Loss and performance reports | Production and CI engineers | Days to weeks | Largest losses by line, product, reason; trends |
| Management KPIs | Plant and site management | Weekly, monthly | Performance against targets across lines and sites |
| Compliance records | Quality, regulators, customers | Per batch or unit | Electronic batch records, genealogy, device history records |
| Traceability queries | Quality, customer service | On demand | Where-used and where-from for lots and serials |
Design each report around one decision. A dashboard with fifty numbers rarely helps anyone act.
KPI definitions
KPIs are only comparable if they are defined the same way everywhere. ISO 22400 (Key performance indicators for manufacturing operations management) defines a set of KPIs and their time and quantity elements, and is a useful reference when agreeing definitions across sites.
| KPI | Definition (simplified) |
|---|---|
| Availability | Actual run time ÷ planned busy (production) time |
| Performance (effectiveness) | (Ideal cycle time × total count) ÷ actual run time |
| Quality rate | Good count ÷ total count |
| OEE | Availability × Performance × Quality rate |
| First pass yield (FPY) | Units good first time, without rework ÷ units started |
| Scrap rate | Scrapped quantity ÷ produced quantity |
| Schedule adherence | Orders (or quantity) completed as scheduled ÷ orders (or quantity) scheduled |
| Changeover time | Time from last good unit of one product to first good unit of the next |
| MTBF / MTTR | Mean operating time between failures; mean time to repair |
| Throughput | Good units produced per unit of time |
Decisions that change the numbers, and must be written down:
- What counts as planned production time (are breaks, planned maintenance and “no orders” excluded?).
- Which ideal cycle time is used (nameplate, validated best rate, or standard?).
- Whether short stops count as availability or performance loss.
- Where good and reject counts are measured.
Two plants using different rules can report OEE values that look very different for identical performance.
Worked OEE example (illustrative)
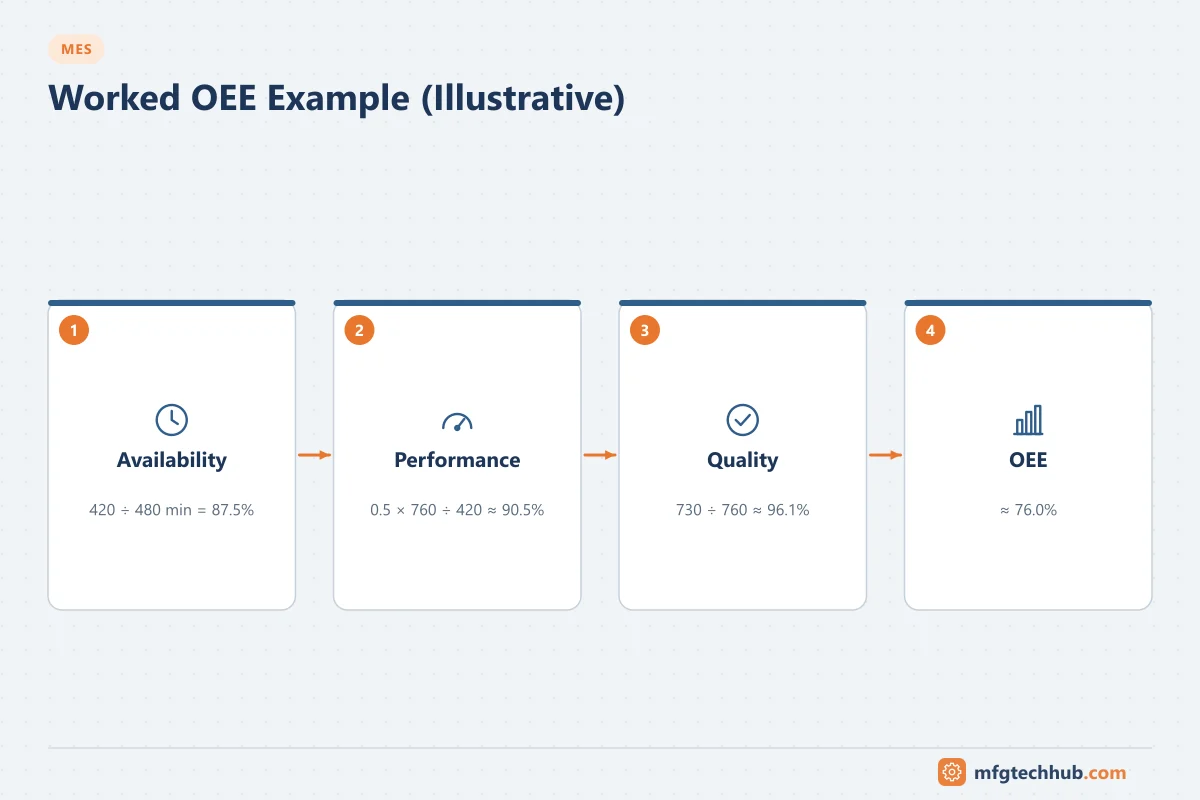
- Planned production time: 480 min; stops: 60 min → run time 420 min → Availability = 420 ÷ 480 = 87.5%
- Ideal cycle time: 0.5 min/unit; total count: 760 → Performance = (0.5 × 760) ÷ 420 ≈ 90.5%
- Good count: 730 → Quality = 730 ÷ 760 ≈ 96.1%
- OEE ≈ 0.875 × 0.905 × 0.961 ≈ 76.0% (equivalently, good count × ideal cycle time ÷ planned time = 730 × 0.5 ÷ 480 ≈ 76.0%)
Check your own figures with the OEE Calculator.
Loss analysis and root cause
- Pareto of losses: sort downtime, speed and quality losses by size for a line or product. The top few reasons usually dominate.
- Drill down: from site to line to machine to reason, and by product, shift and crew, to see where a loss is concentrated.
- Trend: is the loss stable, growing, or linked to a change (new material supplier, recipe change, new crew)?
- Correlate with process data: combine MES events with historian data to compare good and bad periods. See Industrial Historians.
- Root cause methods: 5 Whys, cause-and-effect (fishbone) diagrams, and structured problem solving, followed by verification that the loss really fell.
- SPC: control charts on critical characteristics to distinguish normal variation from special causes. See MES Quality Management.
Reports only create value when someone owns each major loss and follows it to a verified fix.
Advanced analytics and AI in MES: realistic use cases
| Use case | What it does | Data it needs |
|---|---|---|
| Predictive maintenance | Predicts equipment failure from vibration, temperature, current or cycle data | Condition data plus a history of failures and maintenance. See Predictive Maintenance Example |
| Quality prediction (soft sensors) | Estimates a quality result from process data before lab results are available | Process data aligned with lab results by batch or time |
| Anomaly detection | Flags unusual process or machine behaviour | Enough normal-operation data, contextualised by product and state |
| Visual inspection | Detects defects with machine vision and deep learning | Labelled images of good and defective parts. See Machine Vision |
| Scheduling optimisation | Improves sequences to reduce changeovers and late orders | Accurate routings, changeover matrices, capacities. See MES Production Scheduling |
| Loss pattern discovery | Finds combinations of product, material, shift and settings linked to losses | Well-structured MES events and reasons |
Prerequisites that decide success:
- Context: data linked to equipment, product, order, batch and state. Raw tag data without context is hard to use.
- Labels: failures, defects and quality results must be recorded consistently, or models cannot learn.
- Data quality: time alignment, units and missing data handled; see MES Data Collection and Integration.
- Operational ownership: someone must act on a prediction, and the process must be defined.
- Monitoring: models drift when products, materials or equipment change; performance must be monitored and models retrained.
- Validation in regulated industries: models that influence GMP decisions fall under computerised system and data integrity expectations. See Computerised System Validation.
For broader coverage, see AI in Manufacturing and Data Analytics.
Where reporting should live
| Need | Usual home |
|---|---|
| Real-time line status, shift reports, batch and genealogy records | MES |
| Process trends and high-resolution time-series analysis | Historian |
| Cross-site, cross-system analysis combining MES, ERP, quality and maintenance data | Enterprise data platform with BI tools |
| Data science and machine learning | Data platform with contextualised data exported from MES and historian |
Avoid building complex enterprise reporting inside the MES database. It affects performance and makes upgrades harder. Replicate data to a reporting or data platform instead.
Troubleshooting reports
| Symptom | Likely causes | Check |
|---|---|---|
| Two reports show different OEE | Different definitions of planned time, ideal cycle time or counting points | KPI definitions and calculation logic |
| OEE above 100% or performance above 100% | Ideal cycle time too slow; counts from the wrong point | Ideal rate and count source |
| Reports slow or time out | Queries on the live MES database, missing indexes, large date ranges | Move to reporting database; optimise queries |
| Numbers change after the shift | Late operator entries, corrections, delayed interface data | Data entry cut-off and correction rules |
| Management does not trust the numbers | Unexplained differences to ERP or physical counts | Regular reconciliation and published definitions |
Frequently asked questions
What KPIs does an MES report?
Typically OEE and its components (availability, performance, quality), throughput, first pass yield, scrap, schedule adherence, changeover times, downtime by reason, MTBF and MTTR, and labour productivity. ISO 22400 provides standard KPI definitions.
How is OEE calculated?
OEE = Availability × Performance × Quality rate, where availability is run time divided by planned production time, performance is ideal cycle time multiplied by total count divided by run time, and quality is good count divided by total count.
Is AI part of MES?
Some MES products include analytics and AI features, but many AI use cases run on a separate data platform using contextualised data from the MES and historian. Success depends more on data context, labels and ownership than on the algorithm.
Key takeaways
- Design reports for a specific audience and decision.
- Publish KPI definitions (ISO 22400 is a good reference) and apply them consistently.
- Use Pareto, drill-down, trend and root cause analysis, and verify that fixes reduce losses.
- AI works when data is contextualised, labelled and owned; start with a clear use case.
Related tutorials
Before you apply this in a plant: this article is for education. Always check the current edition of the relevant standards, the manufacturer's documentation for your exact product and version, and your site's procedures. Safety-related work needs qualified personnel. See our editorial policy.