
Function Generators, Spectrum Analyzers and Signal Testing
On this page
Testing electronic equipment often needs two capabilities: generating a known signal to feed into a circuit, and analyzing what frequencies are present in a signal. Function generators and arbitrary waveform generators do the first; spectrum analyzers do the second. Together with oscilloscopes and multimeters, they are the core tools of an electronics test bench and are widely used in design, repair and quality testing of industrial electronics.
Function generators
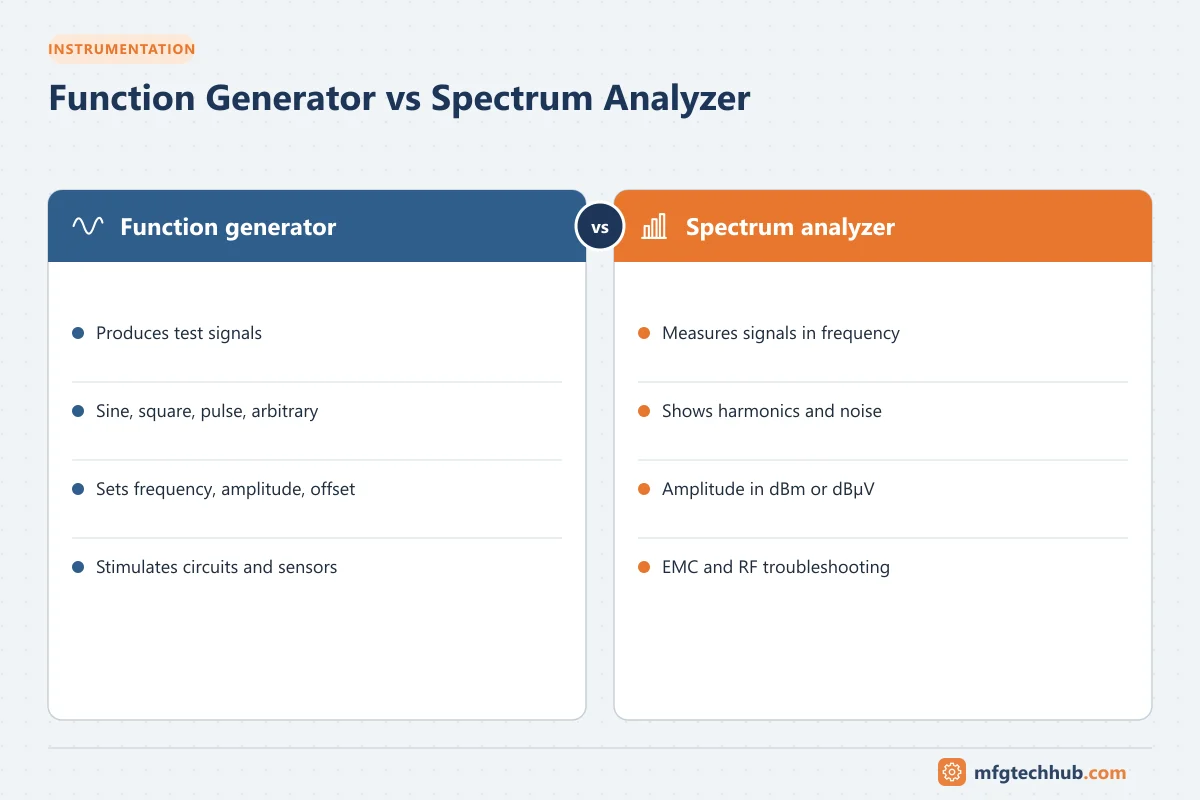
A function generator produces standard waveforms with adjustable frequency, amplitude and offset:
- Sine waves
- Square and pulse waves (with adjustable duty cycle)
- Triangle and ramp waves
- Noise
Modern instruments use direct digital synthesis (DDS) for stable, precise frequencies.
Arbitrary waveform generators (AWGs)
An AWG can output any waveform defined by the user, such as a recorded sensor signal, a distorted mains waveform or a complex modulated signal. This allows realistic testing of how equipment responds to real-world conditions.
Key specifications
| Specification | Meaning |
|---|---|
| Frequency range | Maximum sine frequency (from a few MHz to hundreds of MHz) |
| Amplitude range and resolution | Output voltage levels and precision |
| Output impedance | Usually 50 Ω; the displayed amplitude assumes a matched load |
| Sample rate and memory (AWG) | Detail and length of arbitrary waveforms |
| Modulation | AM, FM, PWM, sweep and burst modes |
| Channels | One or two, often with phase control between them |
Common mistake: a generator set for 1 V into 50 Ω will output about 2 V into a high-impedance input. Set the instrument’s load setting to match the circuit.
Industrial uses
- Simulating sensor and encoder signals to test controllers and counters
- Injecting test signals to check filters and signal conditioning circuits
- Testing frequency and pulse inputs (flowmeter pulses, speed sensors)
- Generating clock or PWM signals for circuit testing
- Frequency response testing of amplifiers and control electronics
Dedicated process calibrators are usually better for simulating 4-20 mA, thermocouple and RTD signals. See Loop Calibrators for Process Control Equipment.
Spectrum analyzers
An oscilloscope shows signals in the time domain. A spectrum analyzer shows them in the frequency domain: how much energy is present at each frequency. Many problems are much easier to see this way, including harmonics, interference, noise sources and communication signals.
Types
| Type | How it works | Strengths |
|---|---|---|
| Swept-tuned | Scans a narrow filter across the frequency range | Wide dynamic range; traditional RF analysis |
| FFT analyzer | Digitizes the signal and computes the Fast Fourier Transform | Fast; good for low frequencies and transient events |
| Real-time spectrum analyzer | Continuous FFT processing without gaps | Captures brief, intermittent signals |
| Oscilloscope FFT function | FFT of captured waveforms | Convenient for basic frequency analysis |
Key specifications
| Specification | Meaning |
|---|---|
| Frequency range | Lowest and highest frequencies measured |
| Resolution bandwidth (RBW) | Ability to separate closely spaced signals; narrower RBW shows more detail but sweeps more slowly |
| Displayed average noise level (DANL) | The weakest signal that can be seen |
| Dynamic range | Range between the largest and smallest signals that can be measured at the same time |
| Amplitude accuracy | How accurately signal levels are measured (often in dBm) |
Industrial and electronics uses
- EMI pre-compliance testing: checking emissions from products and cabinets before formal EMC tests. See EMI/EMC Testing.
- Wireless systems: checking channels, interference and signal strength for Wi-Fi, WirelessHART and other industrial wireless networks.
- Harmonic analysis: identifying harmonic content in power electronics (dedicated power analyzers are used for mains power quality).
- Vibration analysis: FFT analyzers are the basis of machine vibration analysis. See Vibration Analysis for Rotating Equipment.
- Finding noise sources: identifying the frequency of interference affecting sensor signals, which often points to the source (for example drive switching frequency).
Understanding decibels
Spectrum analyzers display amplitude in decibels:
dB (power ratio) = 10 × log10(P₂ ÷ P₁)
dBm = 10 × log10(P ÷ 1 mW)
Every 10 dB is a factor of 10 in power; every 3 dB is roughly a factor of 2. 0 dBm is 1 mW, and −30 dBm is 1 µW.
A simple signal testing workflow
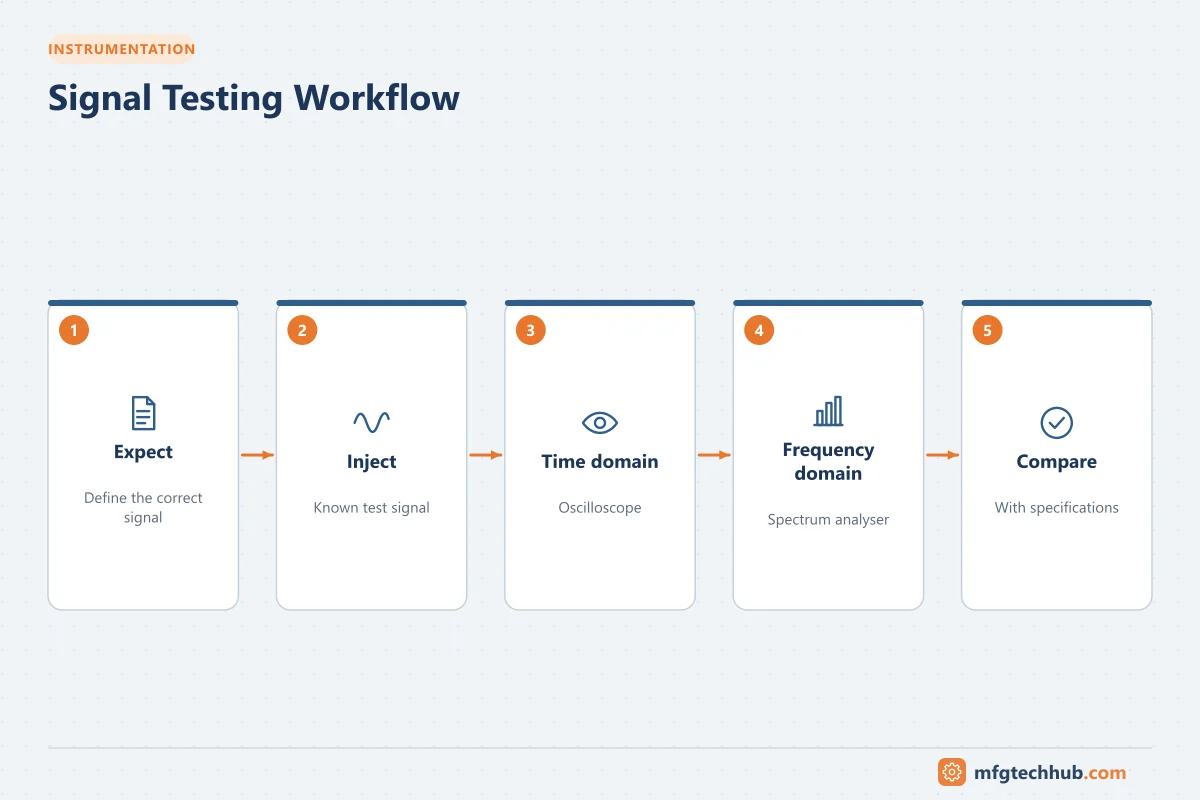
- Define what you expect: frequency, amplitude, waveform shape.
- Inject a known signal with the generator, if testing a circuit or input.
- Observe in the time domain with an oscilloscope.
- Check the frequency content with a spectrum analyzer or FFT.
- Compare with specifications and investigate differences.
Key takeaways
- Function generators and AWGs provide known signals for testing circuits and inputs.
- Spectrum analyzers reveal frequency content, making harmonics, noise and interference visible.
- Match generator load settings to the circuit, and choose analyzer RBW and range for the task.
Related tutorials
Before you apply this in a plant: this article is for education. Always check the current edition of the relevant standards, the manufacturer's documentation for your exact product and version, and your site's procedures. Safety-related work needs qualified personnel. See our editorial policy.