
Vibration Analysis for Rotating Equipment: Sensors, FFT and Faults
On this page
Every rotating machine vibrates. What matters is how much, at what frequency, and whether it is changing. Vibration analysis turns those measurements into a diagnosis: an unbalanced fan, a misaligned coupling, a worn bearing or a loose foundation each leave a characteristic signature. It is the most widely used technique for condition monitoring of pumps, motors, fans, compressors and gearboxes.
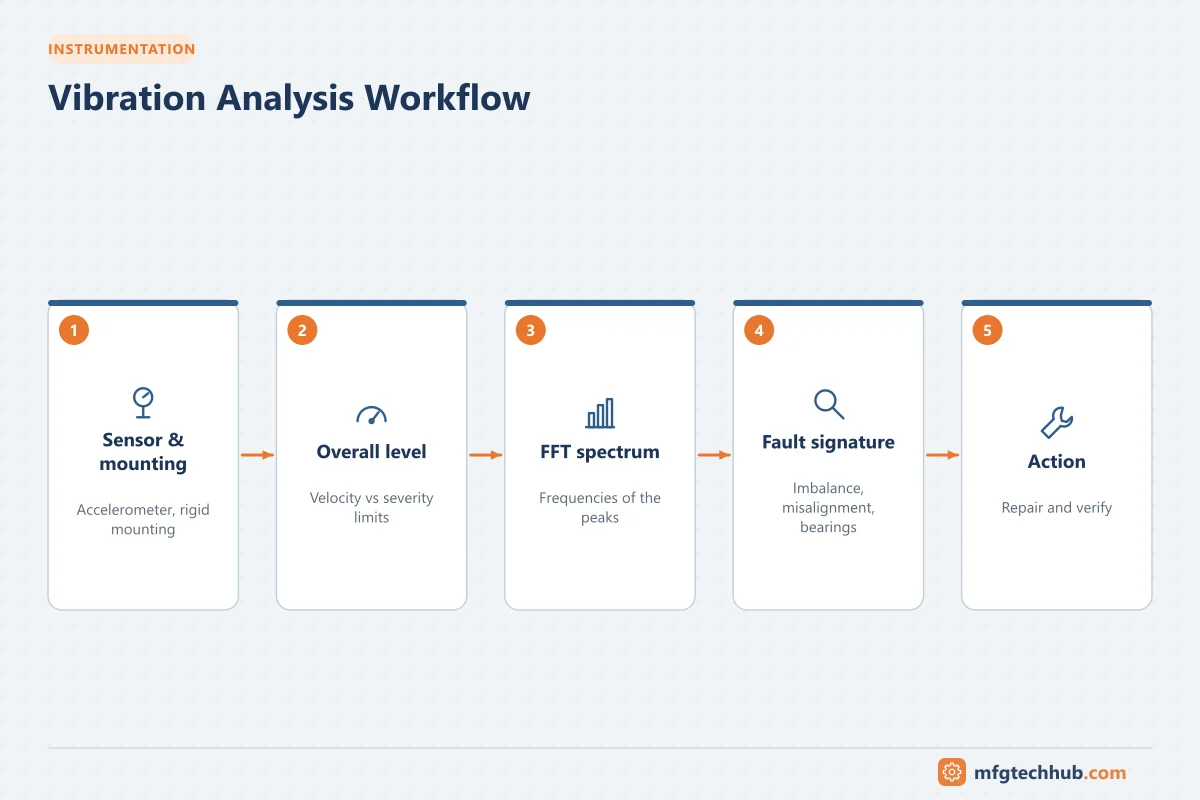
This article explains the sensors used to measure vibration, how vibration is expressed, how frequency analysis works, and how to recognize the most common machine faults.
Displacement, velocity and acceleration
Vibration can be described in three related ways:
| Quantity | Unit | Best for |
|---|---|---|
| Displacement | µm or mils (peak-to-peak) | Low frequencies; shaft movement in sleeve bearings |
| Velocity | mm/s or in/s (RMS) | General machine condition, roughly 10 Hz to 1 kHz |
| Acceleration | g or m/s² | High frequencies; rolling-element bearing and gear faults |
For a single frequency, the three are linked: velocity = 2πf × displacement, and acceleration = 2πf × velocity. This means high-frequency problems show up strongly in acceleration, while low-frequency problems dominate displacement. Velocity in mm/s RMS is the most common single number for overall machine condition because damage potential is fairly constant in velocity over the typical machine frequency range.
Vibration sensors
Accelerometers
Piezoelectric accelerometers are the most widely used sensor. A small mass presses on a piezoelectric crystal; vibration changes the force and the crystal produces a charge proportional to acceleration. Most industrial accelerometers include built-in electronics (IEPE or ICP type), powered by a constant current of a few milliamps, and output a voltage signal, typically 100 mV/g.
MEMS accelerometers are smaller and cheaper, and are common in wireless condition monitoring sensors, although their frequency range and noise floor are usually more limited.
Velocity sensors
Traditional velocity sensors used a moving coil and magnet. Today, most velocity measurements come from accelerometers with integrated electronics, and 4-20 mA vibration transmitters that output overall velocity are popular for connecting to PLC and DCS systems.
Proximity probes
Eddy-current proximity probes measure the gap between the probe tip and the shaft without contact. They are standard on large turbomachinery with sleeve (fluid-film) bearings, where the shaft moves within its bearing clearance. Two probes at 90° show the shaft’s orbit; a keyphasor probe provides a once-per-revolution reference for phase measurement. API 670 defines protection systems for this type of machinery.
Mounting matters
The way an accelerometer is attached determines how high a frequency it can measure accurately:
| Mounting | Usable frequency range |
|---|---|
| Stud mount on a flat, machined surface | Widest; up to the sensor’s rated limit |
| Adhesive mounting pad | Very good |
| Magnet on a flat surface | Good; common for route-based data collection |
| Hand-held probe tip | Limited to low frequencies |
Measure on the bearing housings, as close to the load zone as possible, in horizontal, vertical and axial directions. Use the same locations every time so trends are comparable.
Overall levels and severity
The simplest analysis compares the overall vibration velocity with limits. ISO 20816 (which replaced ISO 10816) provides evaluation zones for different machine classes:
- Zone A: newly commissioned machines
- Zone B: acceptable for unrestricted long-term operation
- Zone C: unsatisfactory for long-term operation; plan corrective action
- Zone D: severe enough to cause damage
Always use the zone limits in the standard for the specific machine type, size and mounting. In practice, the trend matters as much as the absolute value: a steady doubling of vibration on a machine that has been stable for years is a warning even if it is still in zone B.
Frequency analysis (FFT)
An overall level says that something is wrong; a spectrum says what. The Fast Fourier Transform (FFT) splits the vibration signal into its frequency components. Frequencies are usually expressed as multiples of running speed, called orders (1×, 2×, 3× and so on).
Example: a motor running at 1,480 rpm turns at 1,480 ÷ 60 ≈ 24.7 Hz, so 1× is 24.7 Hz and 2× is 49.3 Hz.
Common fault signatures
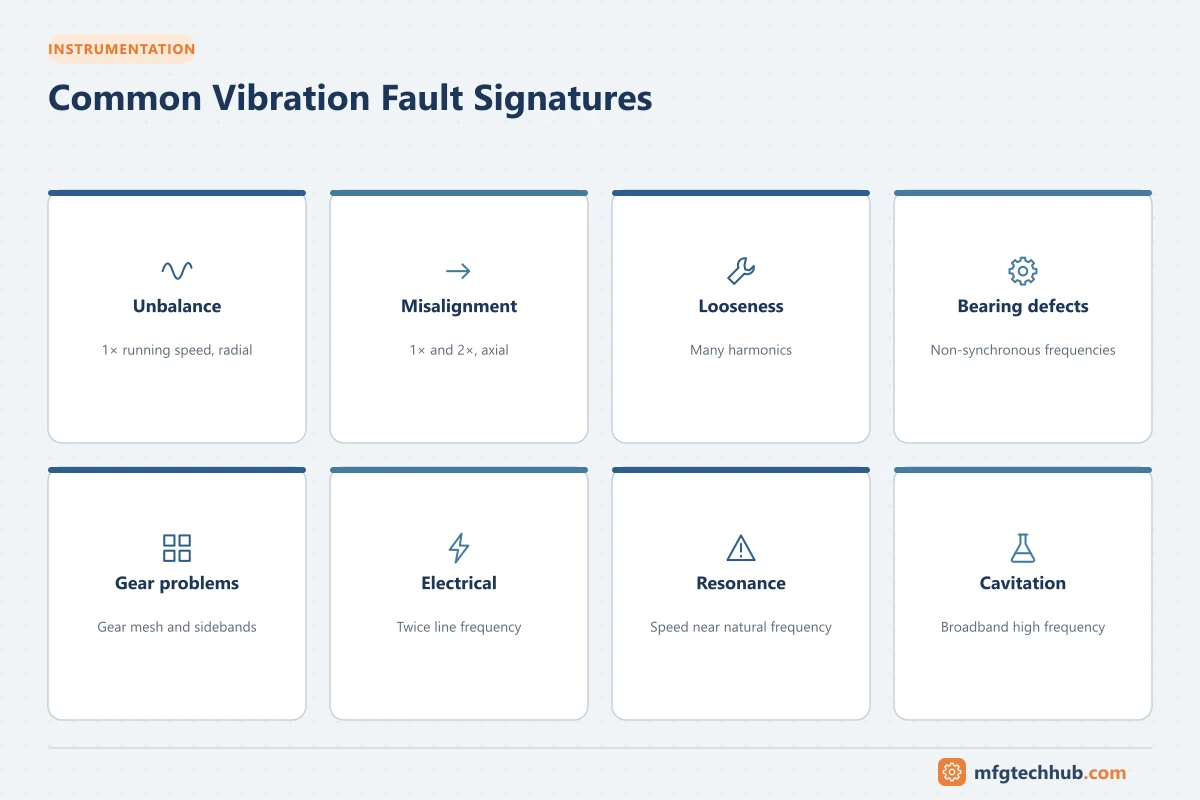
| Fault | Typical signature |
|---|---|
| Unbalance | High 1× radial vibration, in phase; mostly horizontal and vertical, low axial |
| Misalignment | High 2× (and 1×) vibration, often with high axial vibration; phase shift across the coupling |
| Mechanical looseness | Many harmonics of running speed (1×, 2×, 3×…), sometimes half-orders |
| Rolling-element bearing defects | Non-synchronous frequencies (BPFO, BPFI, BSF, FTF) calculated from bearing geometry; high-frequency acceleration |
| Gear problems | Gear mesh frequency (teeth × shaft speed) with sidebands at the shaft speeds |
| Electrical faults in motors | Vibration at twice line frequency (100 Hz on 50 Hz supplies, 120 Hz on 60 Hz), disappearing when power is cut |
| Resonance | High vibration where a forcing frequency matches a natural frequency of the structure |
| Cavitation (pumps) | Broadband, random high-frequency energy |
Bearing defect frequencies
Each rolling-element bearing has four characteristic frequencies based on its geometry: ball pass frequency outer race (BPFO), ball pass frequency inner race (BPFI), ball spin frequency (BSF) and fundamental train (cage) frequency (FTF). Bearing manufacturers publish these as multiples of running speed. Early bearing damage is often detected using envelope analysis (demodulation), which extracts the repetitive impacts of a defect from high-frequency acceleration.
A practical diagnostic approach
- Check the overall level and trend against the machine’s baseline and the ISO 20816 zones.
- Look at the spectrum and identify peaks as multiples of running speed or as known defect frequencies.
- Compare directions: horizontal, vertical and axial readings help separate unbalance from misalignment.
- Use phase where needed to confirm unbalance, misalignment or looseness.
- Correlate with process conditions: load, speed, temperature and flow can change vibration.
- Recommend action and verify the result after repair.
Key takeaways
- Velocity in mm/s RMS is the standard measure of general machine condition; acceleration reveals bearing and gear faults.
- Accelerometer mounting strongly affects the usable frequency range.
- ISO 20816 zones give severity guidance, but trends often matter more than absolute values.
- FFT spectra and bearing defect frequencies turn a vibration reading into a diagnosis.
Related tutorials
Before you apply this in a plant: this article is for education. Always check the current edition of the relevant standards, the manufacturer's documentation for your exact product and version, and your site's procedures. Safety-related work needs qualified personnel. See our editorial policy.