
Infrared Thermography for Predictive Electrical and Mechanical Maintenance
On this page
Many electrical and mechanical failures announce themselves with heat long before they fail: a loose cable lug, an overloaded breaker, a failing bearing or a blocked radiator. Infrared (IR) thermography makes that heat visible, safely and without contact. It is one of the most cost-effective predictive maintenance techniques and a standard part of electrical maintenance programs.
For the principles of infrared measurement and thermal cameras, see Infrared Temperature Sensors and Thermal Imaging.
What thermography can find
Electrical
- Loose, corroded or undersized connections in panels, switchgear and busbars
- Overloaded circuits and unbalanced phases
- Failing breakers, fuses, contactors and disconnect switches
- Overheating transformers and blocked cooling
- Failing capacitors in power factor correction banks
- Hot spots on cable terminations and bus ducts
Mechanical
- Overheating bearings (lubrication problems, misalignment)
- Coupling and belt problems
- Motor overheating and blocked ventilation
- Gearbox problems
Process and building
- Refractory damage in furnaces and kilns
- Failed steam traps and blocked heat exchanger tubes
- Tank levels and sludge build-up (from temperature differences)
- Insulation failures and energy losses
Doing it right: key factors
Load
Electrical problems generate heat in proportion to current (I²R). Inspect equipment under normal operating load, ideally at least about 40% of rated load, and record the load at the time of inspection. A connection that looks fine at light load may be severely overheated at full load.
Emissivity and reflections
- Emissivity is how efficiently a surface emits infrared radiation. Painted surfaces and electrical tape have high emissivity; bare, shiny metals (copper, aluminium, stainless steel) have low emissivity and give misleading readings.
- Shiny surfaces reflect heat from other sources, including the thermographer’s body and lights.
Compare similar components and view from different angles to distinguish real hot spots from reflections.
Access and safety
Opening energized panels exposes workers to arc flash hazards. Options include:
- Following arc flash PPE and procedures when panels must be opened
- Installing IR windows (viewing ports) in switchgear so inspections can be done with doors closed
Interpreting results: severity criteria
Two approaches are common:
- Comparative (ΔT between similar components): compare the same point on the three phases or on identical equipment under similar load.
- Absolute temperature: compare with the maximum allowable temperature for the component and insulation.
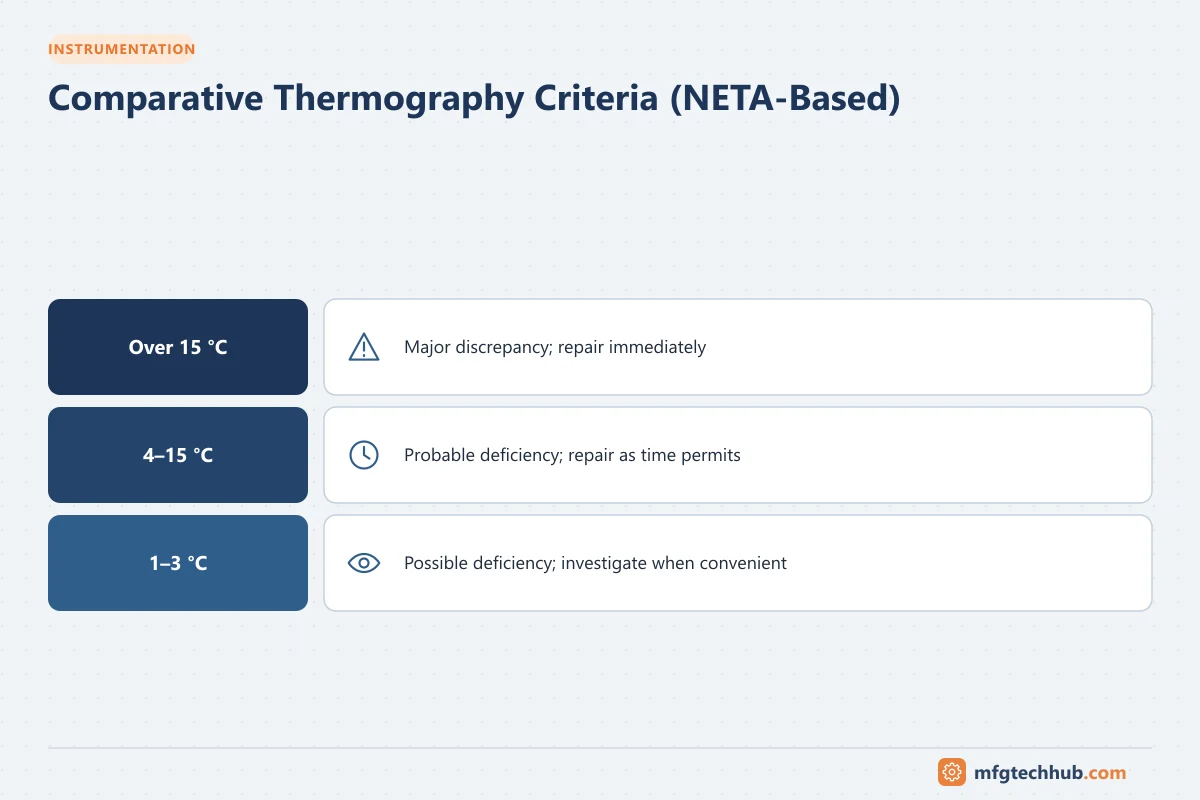
An example of widely used comparative criteria (based on the NETA Maintenance Testing Specifications) for similar components under similar load:
| Temperature difference | Suggested action |
|---|---|
| 1-3 °C | Possible deficiency; investigate when convenient |
| 4-15 °C | Probable deficiency; repair as time permits |
| Over 15 °C | Major discrepancy; repair immediately |
Always use your organization’s criteria, consider load and ambient conditions, and apply engineering judgment.
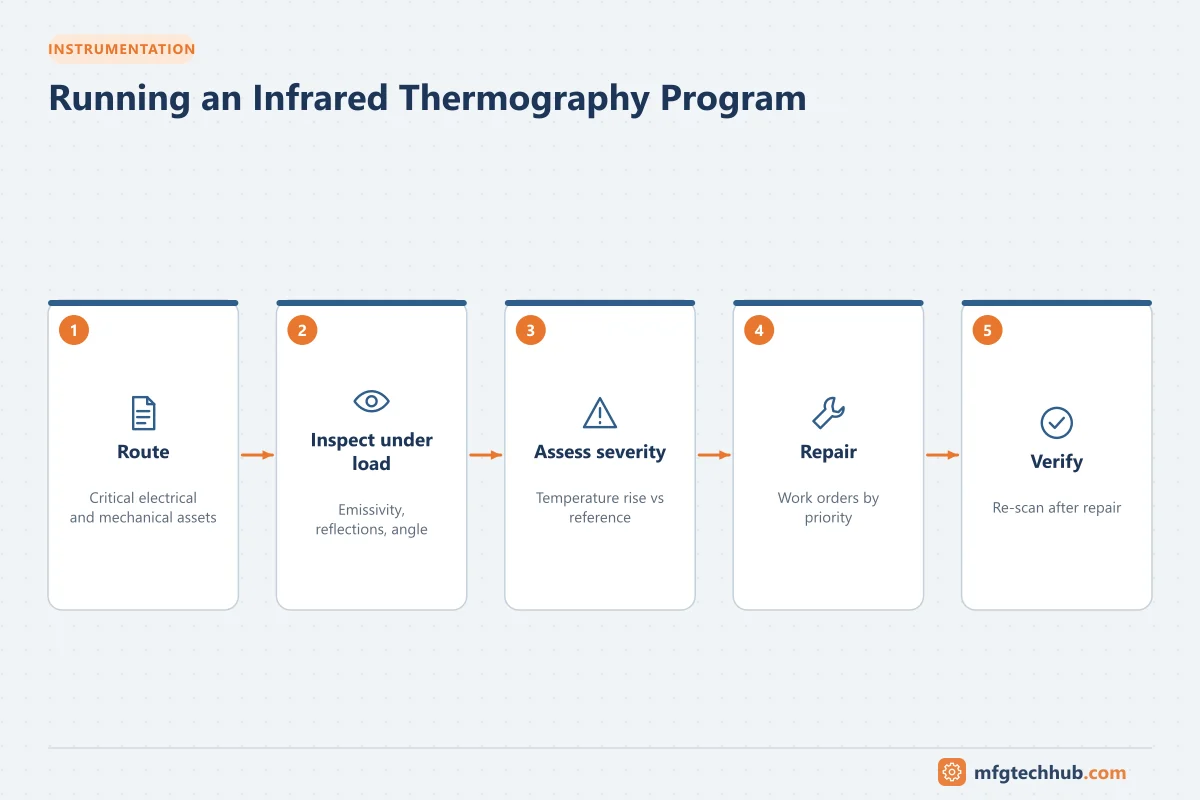
Running a thermography program
- Build a route: list all panels, switchgear, MCCs, transformers and critical machines.
- Set a frequency: commonly annual for electrical equipment, more often for critical or high-risk assets.
- Use qualified personnel: training and certification schemes (for example Level I, II and III thermographer programs, and ISO 18436-7) improve consistency.
- Capture good images: focused, with correct emissivity settings and a visible-light photo for reference.
- Report clearly: location, component, temperatures, ΔT, load, severity, recommended action and photos.
- Track repairs: raise work orders and verify repairs with a follow-up scan.
- Trend results to find recurring problems.
Example findings
| Finding | Likely cause | Action |
|---|---|---|
| One phase of a breaker terminal 25 °C hotter than others | Loose connection | Isolate, clean and re-torque, then re-scan |
| All three phases of a cable hot | Overload or undersized cable | Check load, verify cable rating |
| Motor bearing housing hotter than the other bearing | Lubrication or alignment problem | Check lubrication and alignment; confirm with vibration |
| Cool radiator sections on a transformer | Blocked flow or closed valve | Inspect cooling system |
Benefits
- Detects problems without shutdown or contact
- Prevents fires, unplanned outages and equipment damage
- Helps prioritize maintenance work
- Often recommended or required by insurers for electrical installations
Key takeaways
- Thermography finds loose connections, overloads, bearing problems and insulation failures early.
- Inspect under load, and account for emissivity and reflections.
- Use consistent severity criteria and qualified personnel.
- Follow up every finding with repair and a verification scan.
Related tutorials
Before you apply this in a plant: this article is for education. Always check the current edition of the relevant standards, the manufacturer's documentation for your exact product and version, and your site's procedures. Safety-related work needs qualified personnel. See our editorial policy.