
P&ID vs PFD: Differences, Contents and When Each Is Used
On this page
The Process Flow Diagram (PFD) and the Piping and Instrumentation Diagram (P&ID) both describe a process plant, but at very different levels of detail and for different purposes. The PFD shows what the process does; the P&ID shows everything needed to build, control and operate it. Mixing them up is a common source of confusion for engineers starting in the process industries.
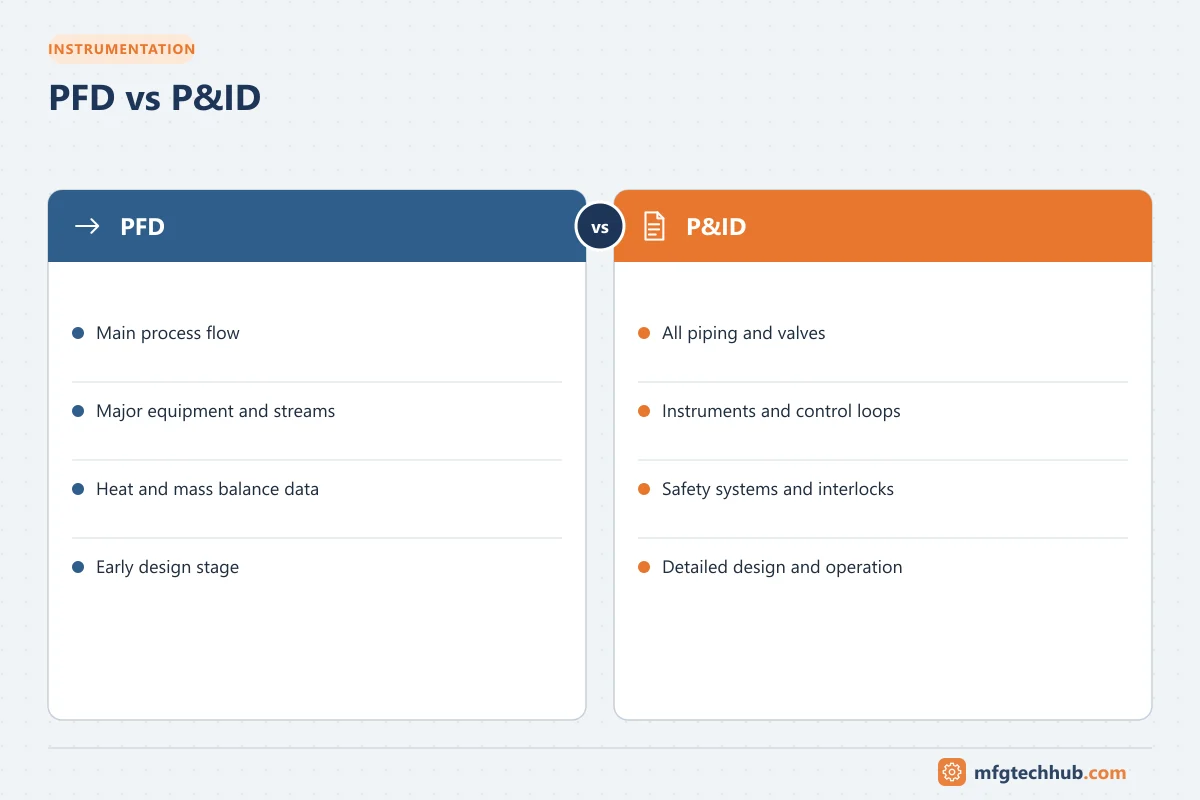
The Process Flow Diagram (PFD)
A PFD is a high-level drawing created early in design, usually by process engineers. It shows:
- Major equipment such as reactors, columns, exchangers, pumps and tanks
- Main process streams and their direction, with stream numbers
- Heat and material balance data for each stream: flow, temperature, pressure and composition, often in a table on the drawing
- Key operating conditions and equipment duties (for example heat exchanger duty in kW)
- Major control concepts in simplified form, sometimes only the most important loops
A PFD normally does not show minor lines, manual valves, pipe sizes, instrument details, relief valves, drains, vents or utility connections.
The Piping and Instrumentation Diagram (P&ID)
A P&ID is developed from the PFD and becomes the master engineering document. It shows:
- All equipment, including spares (A/B pumps), with tag numbers and key design data
- Every line, with line number, size, pipe specification, insulation and tracing
- All valves: manual, control, check, relief and isolation, with sizes and normal positions
- All instrumentation, with ISA tags, control loops, alarms and interlocks
- Safety systems: pressure safety valves, shutdown valves and safety instrumented functions
- Utility connections, drains, vents, sample points and vendor package boundaries
See What Is a P&ID? for more detail.
Side-by-side comparison
| Aspect | PFD | P&ID |
|---|---|---|
| Purpose | Show the process concept and material/energy balance | Define all piping, equipment, instrumentation and control |
| Created by | Process engineers | Process, instrumentation, piping and mechanical engineers together |
| Stage | Conceptual and basic design | Basic design through detailed engineering and operation |
| Equipment shown | Major equipment only | All equipment, including spares and packages |
| Lines | Main process streams | Every process and utility line, with line numbers and sizes |
| Valves | Usually only key control valves | All valves |
| Instruments | Few or none; simplified loops | Every instrument, loop, alarm and interlock |
| Process data | Flows, temperatures, pressures, compositions | Design pressure/temperature, set points, sizes |
| Number of sheets | One or a few | Often dozens or hundreds for a plant |
| Used for | Process design, simulation, cost estimates | Detailed design, HAZOP, construction, commissioning, operations, maintenance |
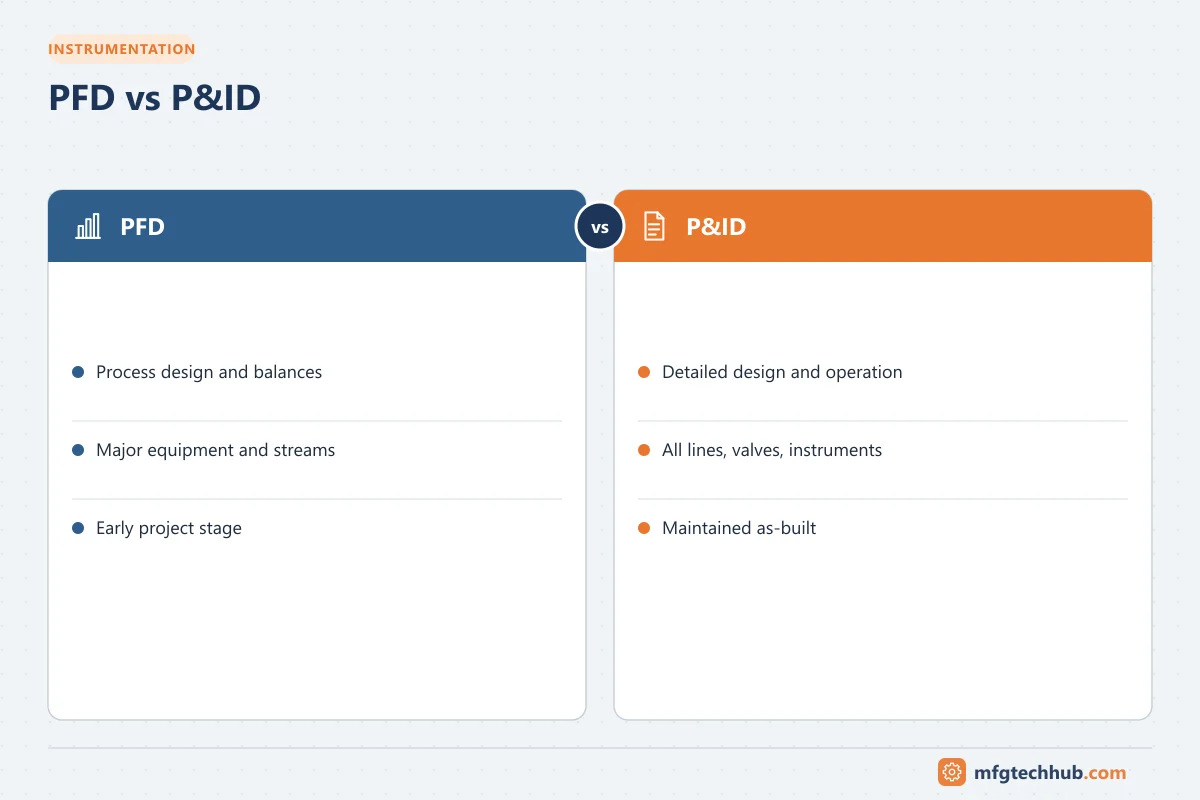
Example: the same heat exchanger on each drawing
On the PFD: a single exchanger E-101 with process stream 5 entering at 40 °C and leaving at 120 °C, and a steam stream. The stream table lists the flows and conditions. There might be a simple TC symbol showing that outlet temperature controls steam.
On the P&ID: the same exchanger with its line numbers and sizes, a temperature element and transmitter (TE/TT-101), a DCS controller TIC-101, the steam control valve TV-101 with its fail-closed action, block and bypass valves around the control valve, a steam trap on the condensate outlet, a pressure safety valve on the shell, vents, drains, temperature and pressure gauges, and alarm points.
Other related diagrams
| Diagram | What it adds |
|---|---|
| Block Flow Diagram (BFD) | Even simpler than a PFD: blocks for process units and main flows |
| Utility Flow Diagram (UFD) | Distribution of steam, cooling water, air and nitrogen |
| Instrument loop diagram | Detailed wiring and connections for each loop (ISA-5.4) |
| Cause-and-effect diagram | Inputs and resulting actions of interlocks and trips |
| Layout / plot plan | Physical positions of equipment |
| Isometric drawing | 3D pipe routing for fabrication |
When to use which
- Use the PFD to understand the overall process, material and energy balances, and design intent.
- Use the P&ID to design control systems, specify instruments, perform HAZOP, plan isolations, commission and troubleshoot.
- Use both together when checking that control and equipment design meet the process requirements.
Key takeaways
- The PFD shows the process concept and balances; the P&ID shows complete functional detail.
- The P&ID is developed from the PFD and becomes the plant’s master drawing.
- Instrumentation, control and safety engineers work mainly from P&IDs.
Related tutorials
Before you apply this in a plant: this article is for education. Always check the current edition of the relevant standards, the manufacturer's documentation for your exact product and version, and your site's procedures. Safety-related work needs qualified personnel. See our editorial policy.