
Digital Power Meters and Energy Monitoring Systems
On this page
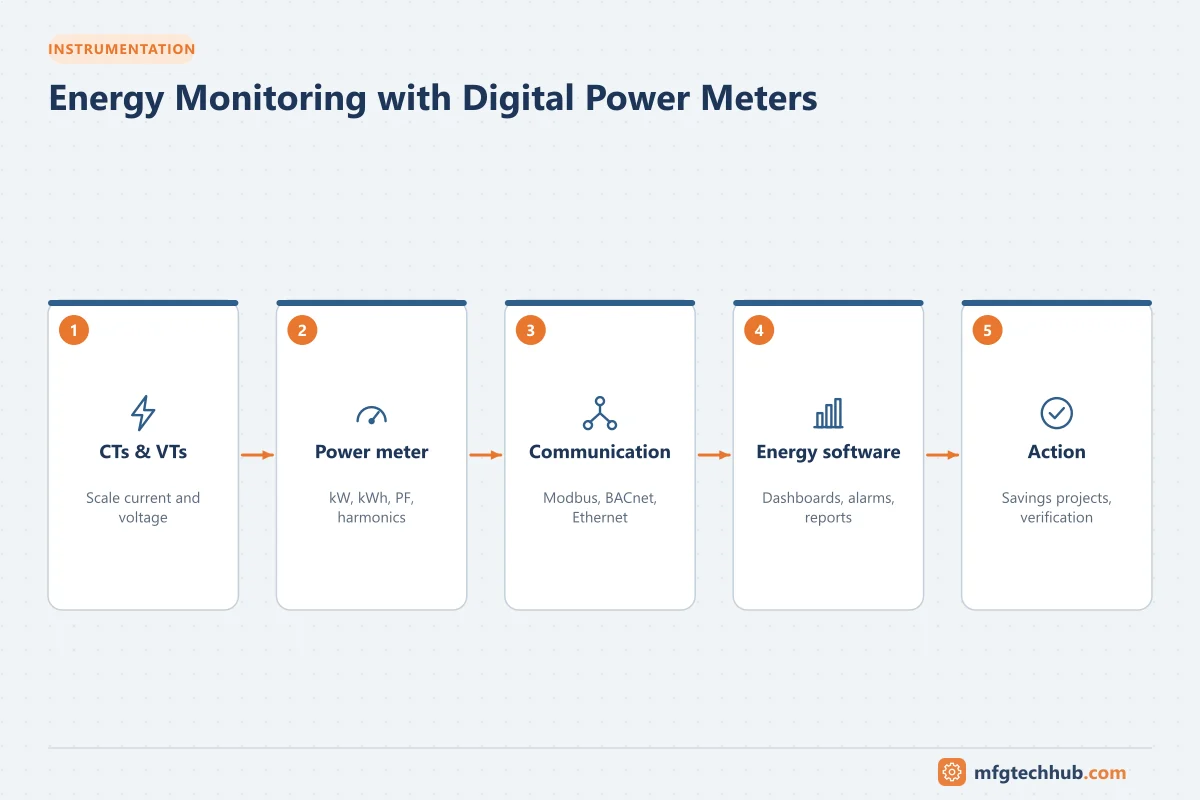
Energy is one of the largest controllable costs in manufacturing, yet many plants only see one number: the monthly utility bill. Digital power meters installed on incoming supplies, distribution boards and major loads show where energy goes, when it is used, and how efficiently. Connected to an energy monitoring system, they turn electrical data into savings, better maintenance and evidence for sustainability reporting.
What a digital power meter measures
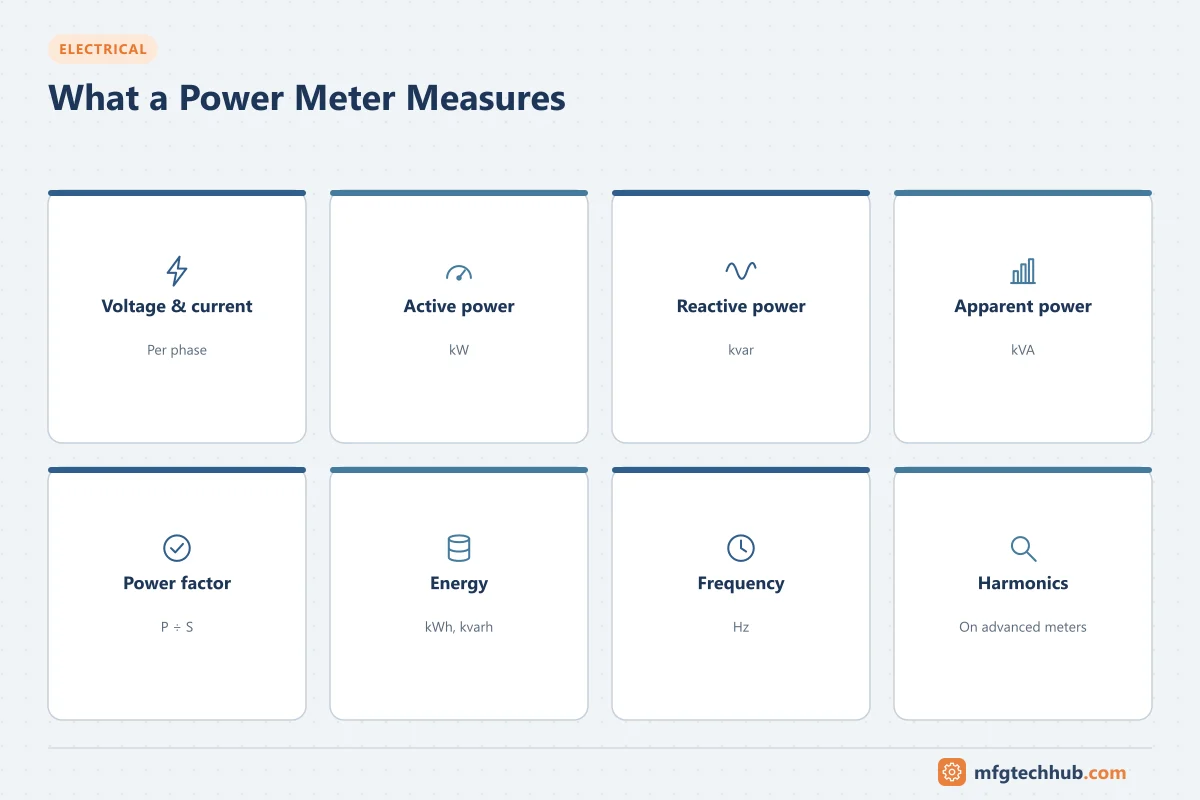
Modern multifunction meters sample voltage and current waveforms thousands of times per second and calculate:
| Quantity | Unit | Meaning |
|---|---|---|
| Voltage (phase and line) | V | Supply voltage on each phase |
| Current | A | Load current on each phase and neutral |
| Active (real) power | kW | Power doing useful work |
| Reactive power | kvar | Power oscillating between source and inductive/capacitive loads |
| Apparent power | kVA | Combination of active and reactive power; what cables and transformers must carry |
| Power factor | — | Ratio kW ÷ kVA |
| Energy | kWh, kvarh | Power integrated over time; the basis of billing |
| Frequency | Hz | Supply frequency |
| Maximum demand | kW or kVA | Highest average power over a demand interval (often 15 or 30 minutes) |
| Harmonics | % THD | Waveform distortion (on meters with power quality functions) |
For a balanced three-phase load:
P (kW) = √3 × V_L (kV) × I (A) × PF
S (kVA) = √3 × V_L (kV) × I (A)
Example: a 415 V motor drawing 50 A at a power factor of 0.85 uses about √3 × 0.415 × 50 × 0.85 ≈ 30.5 kW.
How meters connect: CTs and VTs
Meters rarely carry load current directly. They use instrument transformers:
- Current transformers (CTs) reduce the current to a standard secondary, usually 5 A or 1 A. A 200/5 A CT produces 5 A when 200 A flows. Split-core and Rogowski coil sensors are popular for retrofits because they can be installed without disconnecting cables.
- Voltage transformers (VTs or PTs) are needed on medium- and high-voltage systems; low-voltage meters usually connect directly (through fuses).
Safety note: never open-circuit the secondary of a conventional CT while the primary is energized. The CT can produce dangerously high voltages. Use shorting terminal blocks for maintenance.
Wiring checks
Most meter errors come from installation, not the meter:
- CT polarity reversed on one phase (negative power on that phase)
- CT on the wrong phase compared with the voltage input (wrong power factor)
- Incorrect CT ratio programmed in the meter
Always check phase angles and per-phase power after commissioning.
Accuracy classes
| Standard | Typical classes | Used for |
|---|---|---|
| IEC 62053-21 / -22 (energy) | Class 1, 0.5S, 0.2S | Sub-metering (Class 1 or 0.5S) and revenue/fiscal metering (0.2S) |
| IEC 61557-12 (power monitoring devices) | Defines performance of PMDs | Industrial energy and power monitoring |
| IEC 61869 (instrument transformers) | CT classes such as 0.5, 0.2S | Metering CTs; protection CTs use classes such as 5P |
The overall accuracy depends on the meter and the CTs together. Using a high-class meter with poor or oversized CTs wastes money.
Communication
Meters typically communicate using:
- Modbus RTU (RS-485) or Modbus TCP, the most common in industry
- BACnet in buildings
- PROFINET, EtherNet/IP or other fieldbuses for direct PLC integration
- Pulse outputs for simple kWh counting
- MQTT or cloud connectivity on newer IoT meters
See Industrial Communication Protocols.
Building an energy monitoring system
1. Plan the metering hierarchy
Start at the utility incomer and work down: main switchboard, major distribution boards, then significant loads such as compressors, chillers, furnaces, large motors and production lines. A useful rule is to meter enough loads to account for most of the site’s consumption.
2. Collect and store data
A data acquisition layer (energy management software, SCADA, a historian or an IoT platform) polls meters, typically every few seconds to 15 minutes, and stores time-stamped values.
3. Add production context
Energy data becomes much more valuable when linked to production: kWh per tonne, per unit, or per batch. This comes from MES or PLC counts. See Manufacturing Data and Analytics.
4. Analyze and act
- Identify baseload consumption when production is stopped (nights, weekends)
- Find peak demand events that drive maximum demand charges
- Compare similar machines or lines
- Detect abnormal consumption that indicates faults, such as compressed air leaks or failing bearings
- Verify savings from improvement projects
5. Report
Dashboards for operators, weekly reports for managers, and data for ISO 50001 energy management systems and sustainability reporting.
Typical findings from energy monitoring
- Equipment left running during breaks and weekends
- Compressed air systems with high leakage and poor pressure control
- Simultaneous heating and cooling in HVAC systems
- Low power factor that attracts penalty charges; see Power Factor Correction
- High demand peaks from simultaneous startups
Key takeaways
- Digital meters measure power, energy, demand and power factor from sampled voltage and current.
- CT selection, polarity and phase matching are critical for accurate data.
- Choose accuracy classes to suit the purpose: sub-metering or revenue metering.
- An energy monitoring system needs a metering plan, data collection, production context and action.
Related tutorials
Before you apply this in a plant: this article is for education. Always check the current edition of the relevant standards, the manufacturer's documentation for your exact product and version, and your site's procedures. Safety-related work needs qualified personnel. See our editorial policy.