
Energy Management with PLCs: Metering, Demand Control, Load Shedding and VFD Logic
On this page
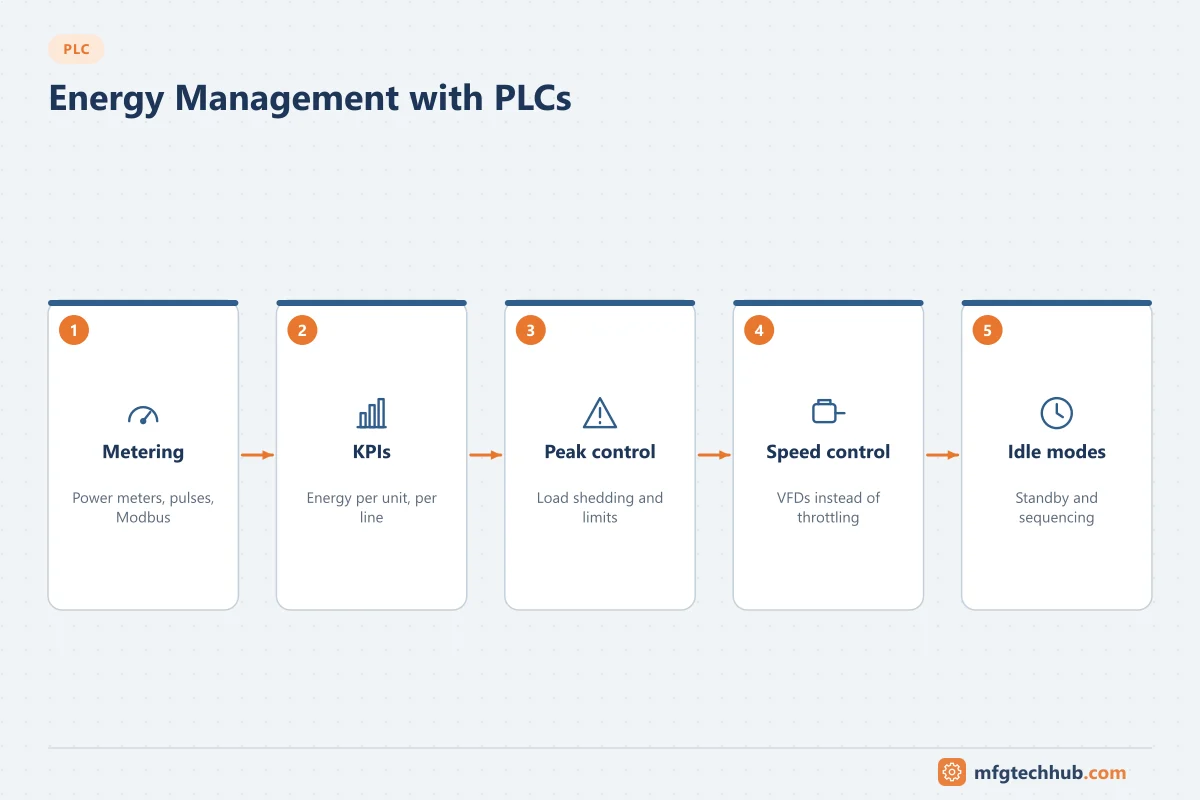
Energy is one of the largest controllable costs in many plants, and the PLC is where much of it is actually controlled: it starts motors, sets drive speeds, sequences compressors and pumps, and decides when equipment can go idle. This article focuses on how to implement energy management functions in PLC logic, from reading meters to shedding loads at peak demand.
For the measurement side (power meters, power quality) see Real-Time Power Monitoring and Digital Power Meters. For plant-wide strategy, see Industrial Energy Efficiency Solutions.
1. Getting energy data into the PLC
| Source | Typical interface | Data |
|---|---|---|
| Multifunction power meters | Modbus RTU/TCP, PROFINET, EtherNet/IP | kW, kWh, kvar, power factor, voltage, current |
| VFDs | Fieldbus/Ethernet | Motor power, current, speed, energy counters |
| Pulse-output meters (electricity, gas, water, steam) | Digital input / high-speed counter | Pulses per unit (for example 1 pulse = 1 kWh) |
| Flow meters for compressed air, steam, gas | 4–20 mA or fieldbus | Flow rate, totaliser |
| Motor protection relays | Fieldbus | Current, thermal load, run hours |
Implementation tips:
- Prefer reading energy counters (kWh) from meters rather than integrating instantaneous kW in the PLC; integration drifts and loses data during PLC stops.
- Handle counter rollover and meter replacement when calculating consumption per period.
- Poll meters at a sensible rate (seconds, not milliseconds) to avoid overloading serial networks.
- Record data quality: flag values when communication to a meter fails, instead of holding the last value silently.
2. Energy KPIs calculated in the PLC or HMI
- Consumption per interval (kWh per 15 min, per hour, per shift)
- Specific energy consumption: kWh per unit produced, per tonne or per m³, which is only meaningful with production counts from the same period
- Idle energy: consumption when the line is not producing, often a large and easily reduced share
- Compressed air per unit, a common hidden cost
Heavy analysis and reporting belong in SCADA, a historian or an energy management system. The PLC provides accurate, time-aligned raw data and executes control actions.
3. Peak demand control and load shedding
Many electricity tariffs include a demand charge based on the highest average power over a demand interval (commonly 15 or 30 minutes, depending on the utility). A short peak can raise the bill for the whole month.
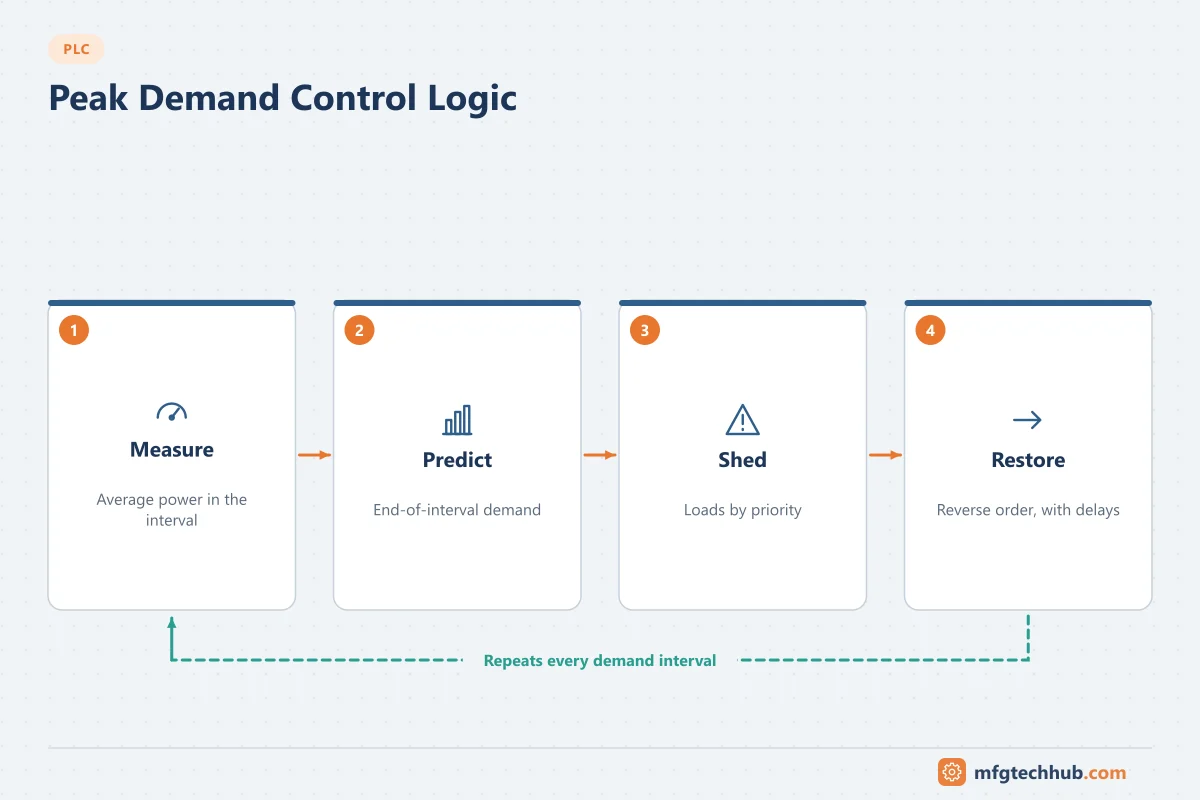
How demand control logic works:
- Measure average power in the current demand interval (from the utility meter’s interval pulse or the power meter).
- Predict the end-of-interval demand from the energy used so far and the current power.
- If the prediction exceeds the target, shed loads in a defined priority order.
- Restore loads when there is margin, in reverse order, with delays to prevent cycling.
| Priority | Example sheddable load | Constraint |
|---|---|---|
| 1 (shed first) | Non-critical HVAC, battery chargers, water heaters | Maximum off time |
| 2 | Chillers with thermal storage, ice builders | Temperature limits |
| 3 | Air compressors with enough receiver capacity | Minimum pressure |
| Never shed | Safety systems, critical process equipment | — |
Design rules:
- Every load needs minimum off time, maximum off time and minimum on time to protect equipment and processes.
- Operators must be able to see which loads are shed and why, and override with authority.
- Shedding must never override safety or process-critical functions.
4. VFD speed control instead of throttling
For centrifugal pumps and fans, the affinity laws mean power varies roughly with the cube of speed. Reducing speed to match demand saves far more energy than throttling with a valve or damper.
In the PLC:
- Replace fixed-speed operation plus valve control with a PID loop that sets drive speed to maintain pressure, flow or level. See PID Control Explained.
- Set minimum speeds to maintain cooling, lubrication and minimum flow requirements of the pump.
- Avoid operating near resonant speeds (skip frequencies in the drive).
- Use drive energy counters to verify savings.
5. Sequencing compressors, pumps and chillers
Running several machines at part load is usually less efficient than running fewer at their best efficiency point.
Compressor sequencing example:
- Measure header pressure (after dryers and filters).
- Use a pressure band for the whole system rather than individual compressor settings that fight each other.
- Run base-load compressors fully loaded; use one variable-speed compressor as trim.
- Start/stop additional machines based on pressure and trim compressor speed, with timers to avoid short cycling.
- Lower the system pressure setpoint to the minimum the users need; each bar of unnecessary pressure costs energy.
The same principle applies to pump stations (duty/assist based on flow and efficiency) and chiller plants (staging based on load and efficiency curves).
6. Idle and standby modes
Machines often consume significant power while waiting: hydraulics running, heaters on, conveyors moving empty, vacuum pumps running.
Idle-mode logic:
- Define an idle state after a time without product or when the upstream is stopped.
- In idle: stop hydraulic pumps, conveyors and fans; lower heater setpoints; close compressed-air supply valves to the machine.
- Define a wake-up sequence with the time needed to be ready (for example heater warm-up), so production is not delayed.
- PROFIenergy (in PROFINET systems) and similar functions provide standard ways to put devices into energy-saving states.
7. Power factor and peak monitoring
PLCs can switch capacitor banks in steps based on measured power factor, although dedicated power factor controllers usually do this. The PLC can also raise alarms for low power factor, high harmonics or voltage imbalance using meter data. See Power Factor Correction.
8. Verifying savings
Energy projects should be verified with measurements:
- Baseline consumption with the relevant variables (production, outdoor temperature).
- Implement the change.
- Compare normalised consumption (for example kWh per unit at similar conditions).
- Keep the measurement running, because savings often decline when settings drift or overrides stay active.
ISO 50001 (energy management systems) and IPMVP-style measurement and verification methods provide structured approaches.
Frequently asked questions
Can a PLC act as an energy management system?
A PLC can collect meter data, calculate basic KPIs and execute control actions such as load shedding and sequencing. Reporting, analysis across sites, tariff calculations and long-term storage are better handled by SCADA, a historian or a dedicated energy management software.
What is demand control?
Demand control limits the peak average power drawn during the utility’s demand interval by temporarily switching off or reducing lower-priority loads, which reduces demand charges on the electricity bill.
How much energy does a VFD save?
It depends on the load profile. For centrifugal pumps and fans running at reduced flow, savings can be large because power falls roughly with the cube of speed. For constant-torque or fully loaded machines, savings are small. Measure before and after.
Key takeaways
- Read energy counters from meters and drives; handle rollover and communication quality.
- Demand control and load shedding need priorities, timing limits and clear operator visibility.
- VFD speed control, equipment sequencing and idle modes are the most effective PLC-level measures.
- Verify savings with normalised measurements.
Related tutorials
Before you apply this in a plant: this article is for education. Always check the current edition of the relevant standards, the manufacturer's documentation for your exact product and version, and your site's procedures. Safety-related work needs qualified personnel. See our editorial policy.