
Bad Tag Quality and Communication Failures: Troubleshooting PLC to SCADA, Historian and MES Data
On this page
“Bad quality”, “comm failure”, question marks on the HMI, flat lines in the historian, MES counts that stop: these are daily problems in integrated plants. Because data passes through several layers (device → PLC → driver or OPC server → SCADA → historian → MES), the fault can be anywhere. This guide gives a layer-by-layer method to find it quickly.
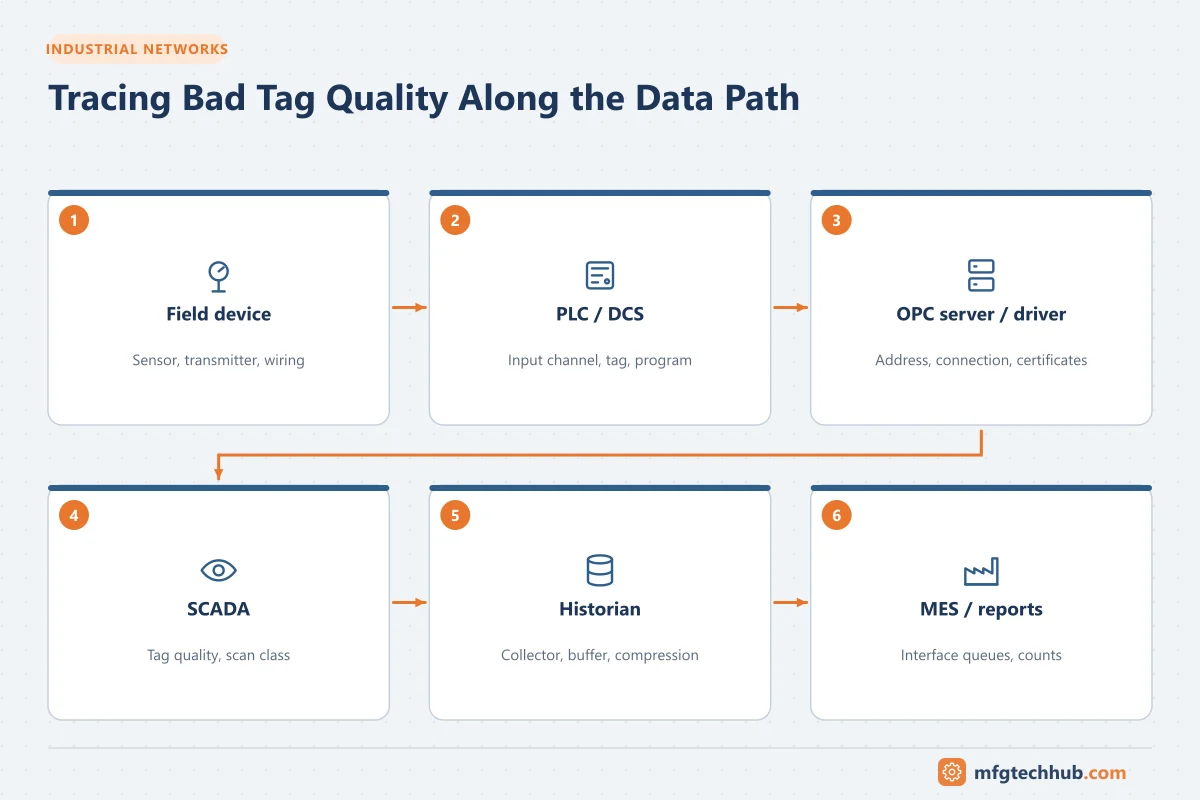
Understand the data path first
Draw the path for the affected tag, for example:
Transmitter → PLC analog input → PLC tag → OPC UA server / driver → SCADA server → historian collector → historian → MES / reports
Then ask at each hop: Is the value correct and is its quality good here? The first hop where the answer changes is where the fault is.
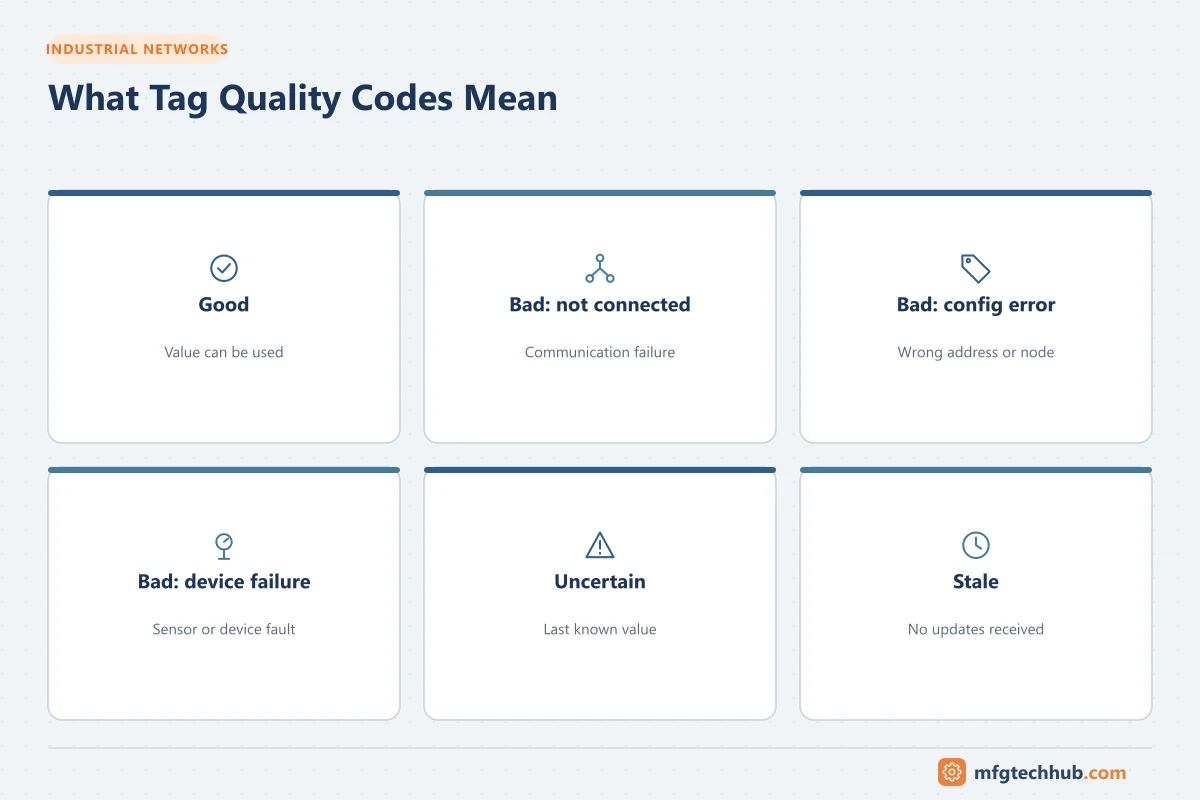
What quality codes tell you
| Quality / status | Typical meaning | First place to look |
|---|---|---|
| Good | Value received normally | If the value is still wrong, check scaling, addressing and the source |
| Bad – not connected / comm failure | The driver or server cannot reach the source | Network, device state, driver configuration |
| Bad – configuration error / node unknown | The address or NodeId does not exist | Tag addressing, PLC program changes, namespace changes |
| Bad – device failure / sensor failure | Source reports a fault (for example a transmitter outside 4–20 mA) | Field device and wiring |
| Uncertain / last known value | Value is old, substituted or outside limits | Communication interruptions, stale data handling |
| Stale (no updates) | Value hasn’t changed for longer than expected | Subscriptions, deadbands, a frozen source |
OPC UA uses detailed status codes (for example BadNotConnected, BadNodeIdUnknown, BadCommunicationError). See OPC UA Explained.
Symptom 1: One tag is bad, others from the same device are good
Likely causes: wrong address or NodeId, tag deleted or renamed in the PLC program, data type mismatch, array index out of range, field device fault on that channel.
Diagnostic steps:
- Check the value and quality of the tag in the PLC (online with the engineering tool).
- If it is bad in the PLC: go to the field (channel diagnostics, wiring, transmitter). See Instrument Troubleshooting.
- If it is good in the PLC: check the tag address in the OPC server/driver and in SCADA; browse the server again after program downloads.
Resolution: correct the address or data type; restore the tag in the PLC or update the mapping.
Prevention: symbolic addressing where available; change management that includes SCADA/historian tag impact when PLC programs change.
Symptom 2: All tags from one device are bad
Likely causes: device offline or in STOP, network path broken, IP changed, connection limit reached, driver stopped, certificate problem (secure protocols), firewall change.
Diagnostic steps:
- Is the device powered and running? Check its status LEDs and diagnostics.
- Ping the device from the SCADA/OPC server and test the application port; check the switch port. See OT Network Troubleshooting.
- Check the driver or OPC server status and its log (timeouts, refused connections, too many connections).
- For OPC UA: check certificates and security settings. See OPC UA Certificate Errors.
- Check recent changes: firewall rules, IP addresses, device replacements, firmware updates.
Resolution: restore the network path, device or configuration; restart the driver only after understanding why it failed.
Prevention: monitor device connection status as alarms; document IP addresses and firewall flows; limit concurrent connections per device.
Symptom 3: Many devices go bad at the same time
Likely causes: switch or network failure, SCADA/OPC server overload or crash, time-out settings too tight under load, broadcast/multicast storm, server patching or reboot, virtual machine host problem.
Diagnostic steps: check network switches and redundancy status, server CPU/memory, service status and event logs, and whether the failures coincide with scheduled tasks (backups, antivirus scans, patching).
Prevention: capacity monitoring, redundant servers and networks, scheduled tasks outside critical periods, tested failover. See Industrial Network Design for OT Engineers.
Symptom 4: Quality is good but the value is wrong
Likely causes: scaling or engineering unit mismatch, off-by-one Modbus addressing, word order of 32-bit values, signed/unsigned interpretation, wrong tag mapped.
Diagnostic steps: compare raw value in the device, PLC value, server value and SCADA value; check scaling at each layer (transmitter range, PLC scaling, SCADA scaling, which should be done in only one place). For Modbus, see Modbus RTU and Modbus TCP Explained.
Prevention: a single, documented place for scaling; tag lists with ranges and units reviewed during commissioning.
Symptom 5: SCADA is fine, but the historian has gaps or flat lines
Likely causes: historian collector disconnected, store-and-forward disabled or buffer full, exception or compression settings too coarse, collector reading from a different server, time synchronisation errors.
Diagnostic steps: check collector status and buffer levels, compare raw historian values with SCADA trends, review exception/compression settings, check timestamps and clocks.
Resolution: reconnect and allow buffers to empty (backfill); adjust settings for affected tags.
Prevention: buffer monitoring, alarms for stale historian tags, appropriate deadbands. See Industrial Historians Explained.
Symptom 6: MES counts or states stop updating
Likely causes: interface service stopped, handshake between MES and PLC stuck (request not acknowledged), counter rollover not handled, message queue backlog, MES server or database issues.
Diagnostic steps: check the interface or connector status and error queues, the handshake flags and sequence numbers in the PLC, and MES logs.
Prevention: cumulative counters with rollover handling, handshake timeouts with alarms, interface monitoring dashboards. See MES Integration Guide.
Symptom 7: Data from MQTT or IIoT platforms is stale
Likely causes: edge gateway disconnected, broker unavailable, duplicate client IDs, expired certificates, Sparkplug birth sequence missed.
Diagnostic steps and prevention: see MQTT and Sparkplug B, which covers state management, rebirths and broker troubleshooting.
Verification after any fix
- The value and quality are correct at every layer of the data path.
- Historian data after the fix is continuous; check whether backfilled data arrived for the outage period.
- Alarms for communication failure have cleared and will trigger again if the fault recurs (test if possible).
- Downstream reports and MES calculations for the affected period are reviewed and corrected if necessary.
Prevention checklist
- Data path documentation for important tags (source → consumers)
- Communication status alarms per device and per interface
- Stale-data detection in SCADA, historian and MES
- Store-and-forward at every hop that supports it
- Scaling done in one documented place
- Change management that includes impact on SCADA, historian and MES tags
- Capacity monitoring of servers and networks
- Certificate and time synchronisation monitoring
Frequently asked questions
What does bad quality mean in SCADA?
It means the SCADA system does not have a trustworthy value for the tag, usually because communication with the source failed, the address is invalid, or the source reported a fault. The displayed value should not be used for decisions until the cause is fixed.
Why is my tag value frozen but the quality good?
The source may be sending the same value (a frozen sensor, a PLC tag no longer written by logic), or a deadband may be filtering small changes. Check the value in the PLC and the device itself.
How do I find where data is lost between the PLC and the historian?
Follow the data path hop by hop and compare value, quality and timestamp at each layer. The first layer where they differ from the previous one contains the fault.
Key takeaways
- Trace the data path hop by hop and compare value, quality and timestamp at each layer.
- The pattern (one tag, one device, many devices, historian only, MES only) points to the layer at fault.
- Prevent problems with communication alarms, stale-data detection, buffering and change management.
Related tutorials
Before you apply this in a plant: this article is for education. Always check the current edition of the relevant standards, the manufacturer's documentation for your exact product and version, and your site's procedures. Safety-related work needs qualified personnel. See our editorial policy.